
If our core philosophy of Row64 1.0 was to scale the data capability of the individual, our core philosophy of V2.0 is to scale the data capability of the team.
We accomplished this by not only further improving our core functions & stability of big data manipulation and data visualization—but by adding learning resources to immediately ramp up new users, and an incredible new data collaboration tool we’re calling the ‘Recipe Universe’. These features all converge to deliver a Row64 that’s faster and easier to use than ever before.
Here’s a breakdown of the exciting improvements based on your feedback that you can expect from our newly release V2.0:
One of Row64’s most popular features is our ‘data science‘ recipes, which takes 300+ Python snippets, and expresses them as drag-and-drop spreadsheet formulas. These recipes package the power of Python into custom workflows at a scale and simplicity not possible in Excel, such as Cohort Analysis and Database Connectors.
With Row64 V2.0, we pushed this concept further, opening up the ability for any Row64 user to create their own recipes by saving their Python scripts to the Recipe Universe. These neatly packaged ‘no-code’ solutions can then be immediately deployed across any team using Row64—including by non-coding analysts.
Plus, our Recipe Universe includes an IDE, meaning it streamlines not just the deployment but the entire creation process of Python recipes—including automated Python package and dependency management (full release notes here).
As part of the Row64 V2.0 release, we increased the data frame manipulation capabilities by, allowing users to drag, edit, re-order and delete columns of up to 1 billion rows. This real-time ‘ Slice & Dice’ capability at this scale is truly groundbreaking, and cannot be found in any competing software.
Animation reveal features have become increasingly useful as a means to display time as a parameter within a visualization. Our V2.0 release utilizes our “easy animate” feature to enable users to animate our static data visualizations, to create racing bar charts, dynamically revealed line charts, and much more
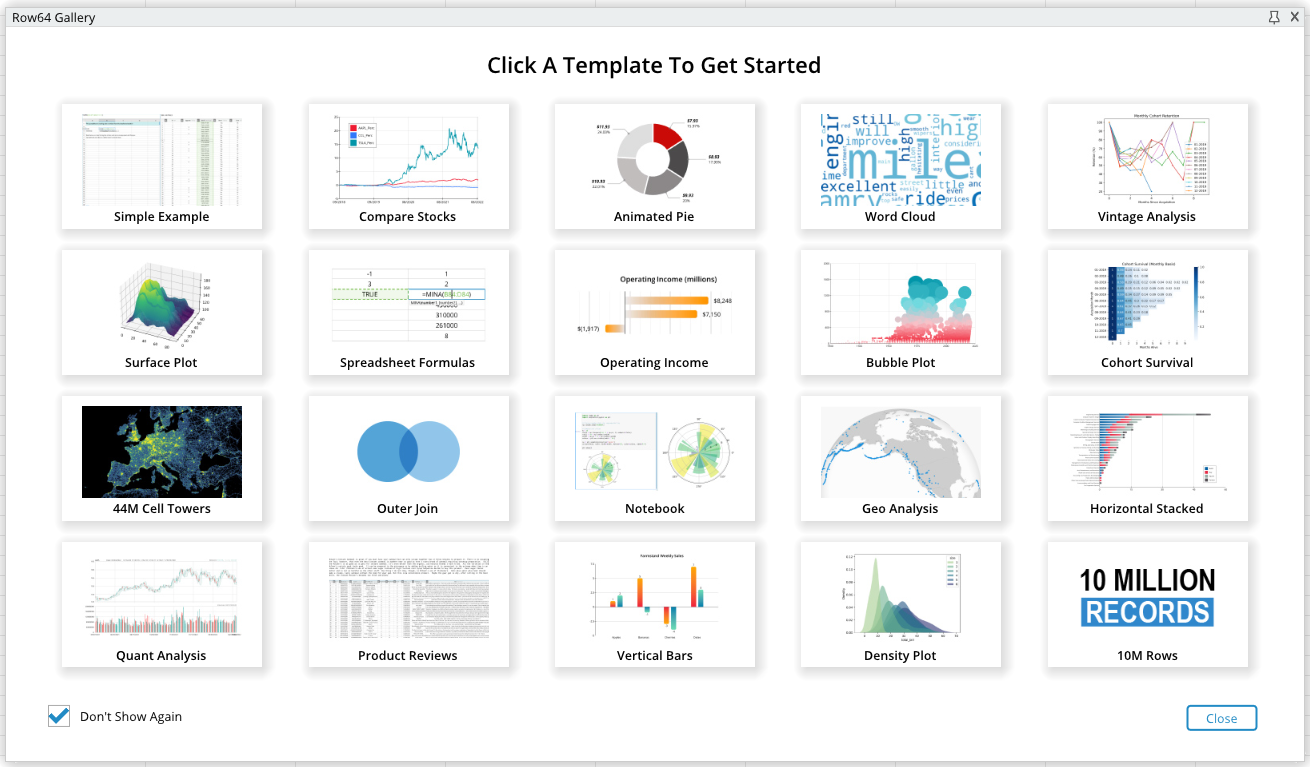
In order to better serve our new users, our V2.0 release comes equipped with a gallery of examples on our range of data visualization, manipulation and discovery tools. Browse example files of geospatial analysis, financial analysis, animated charting, text search to easily grasp the software’s functionality.
When it comes to data, doing is believing. Download our free non-commercial version to experience the power of Row64 V2.0.