DashAPI
Introduction to DashAPI
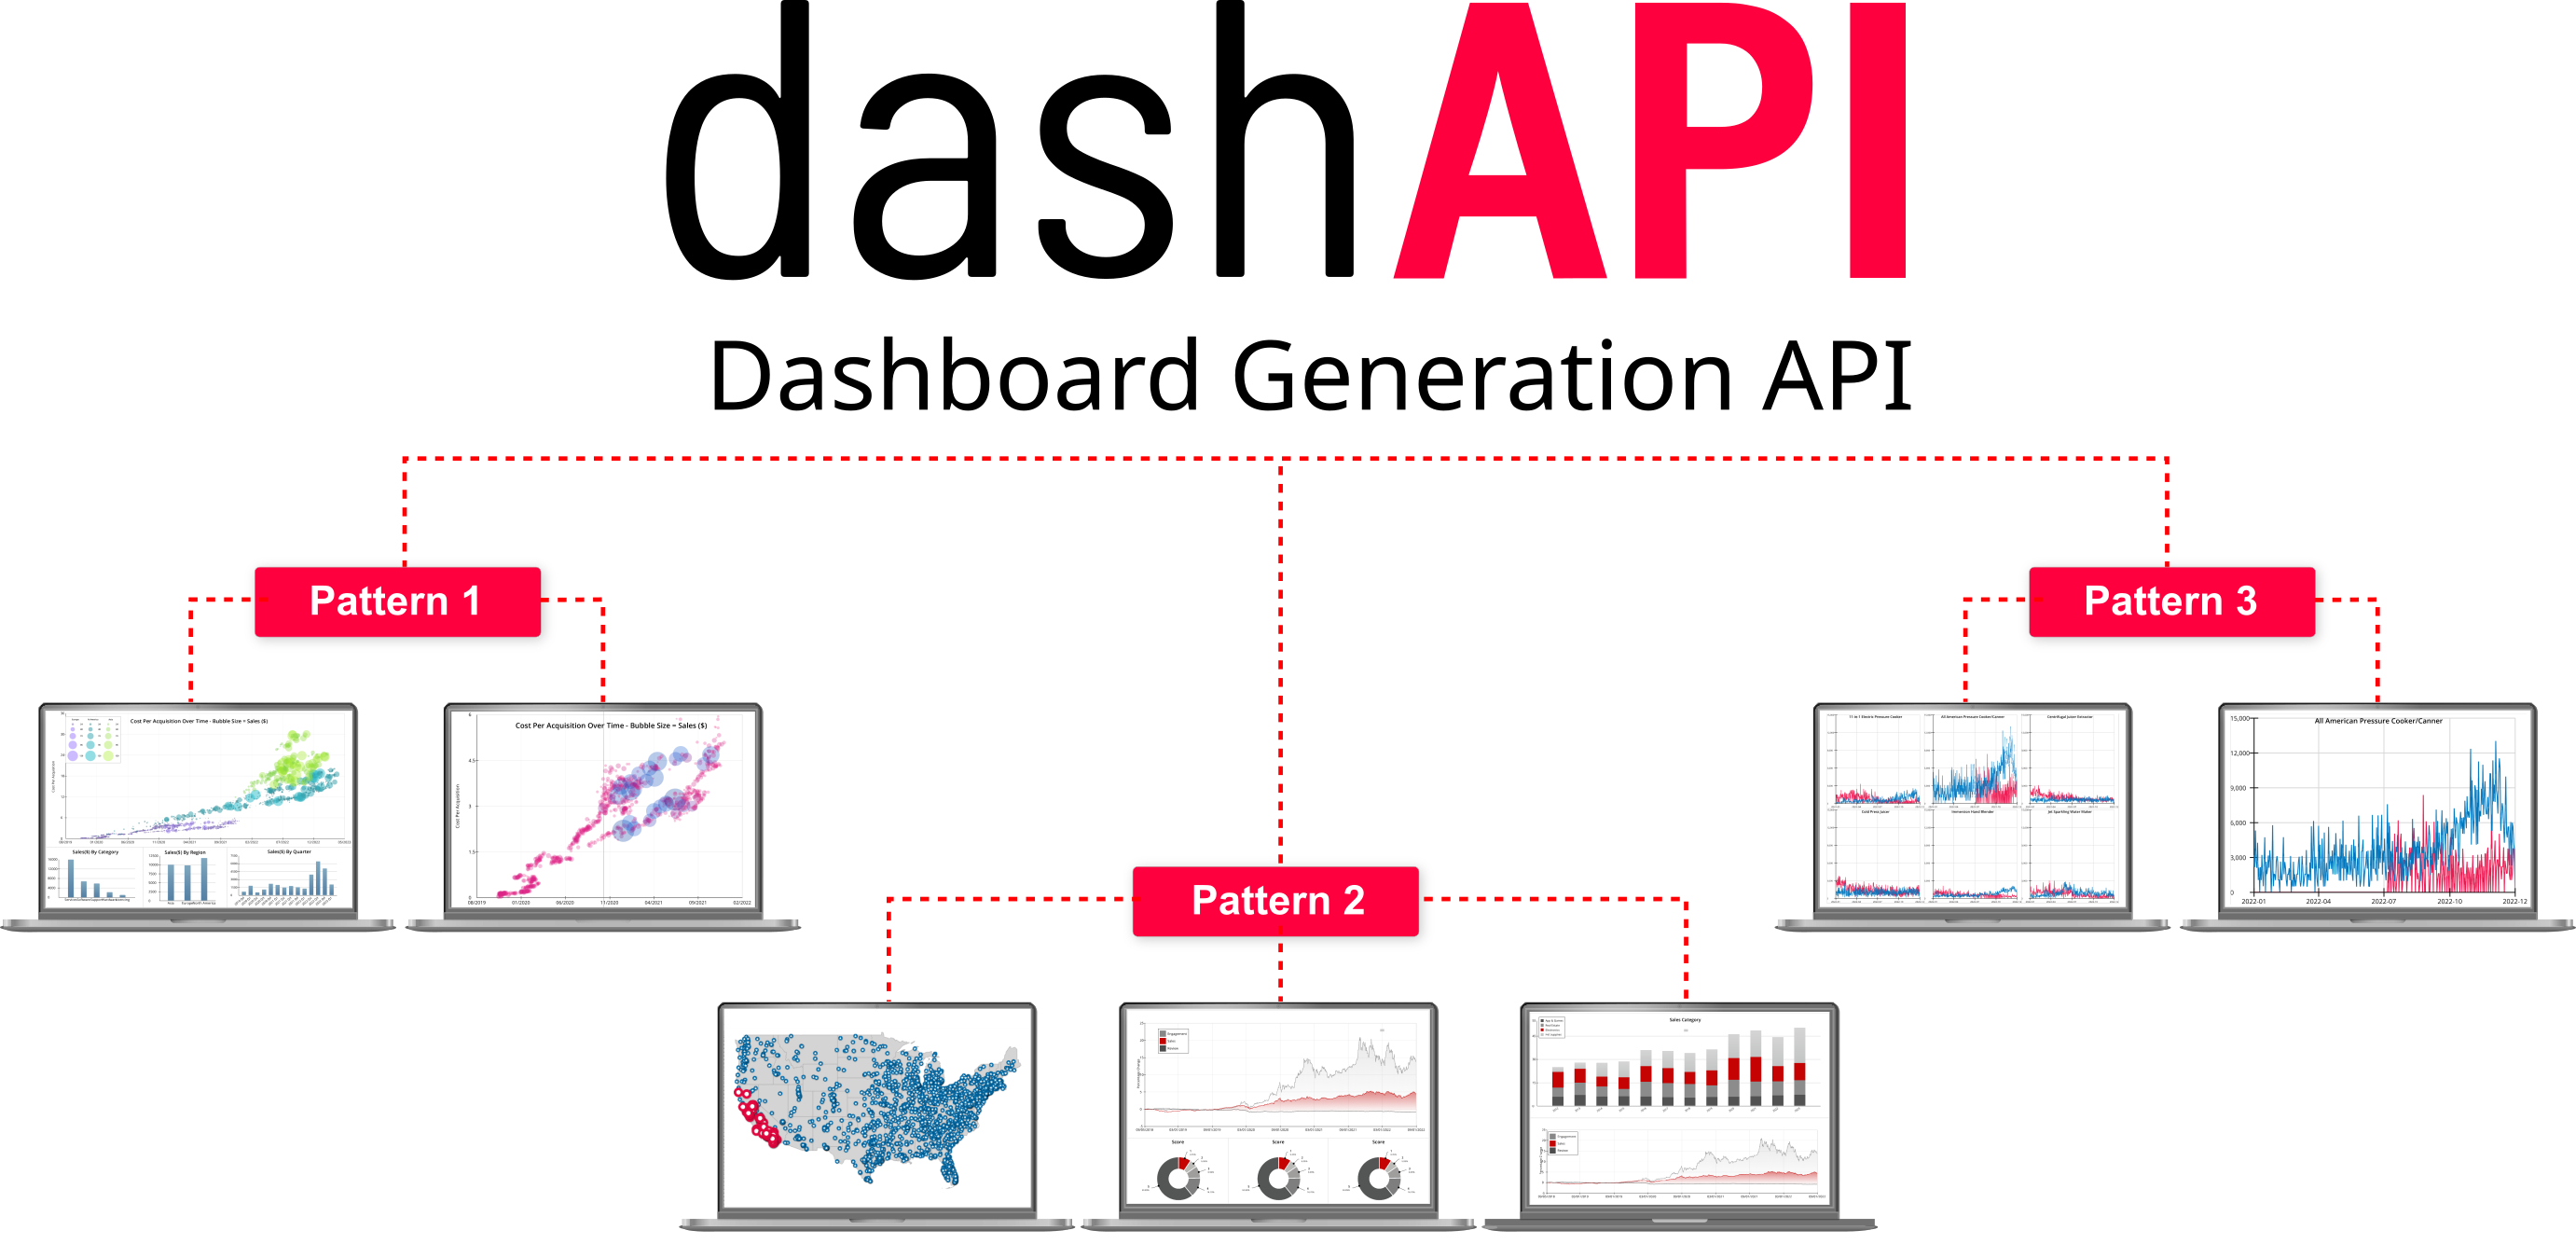
The DashAPI is a Row64 Python library used to generate dashboards. The DashAPI can quickly generate dashboards, whether simple or highly complex, with fine control over visualizations and support for deep data analysis.
All features of Row64 dashboards are available to the DashAPI, which means that all features can be automated. Feature automation can be driven by patterns or manually customized.
The DashAPI can be used to:
- Generate new dashboards from scratch
- Open existing dashboards and make modifications
ByteStream Format
ByteStream is the heart of the DashAPI.
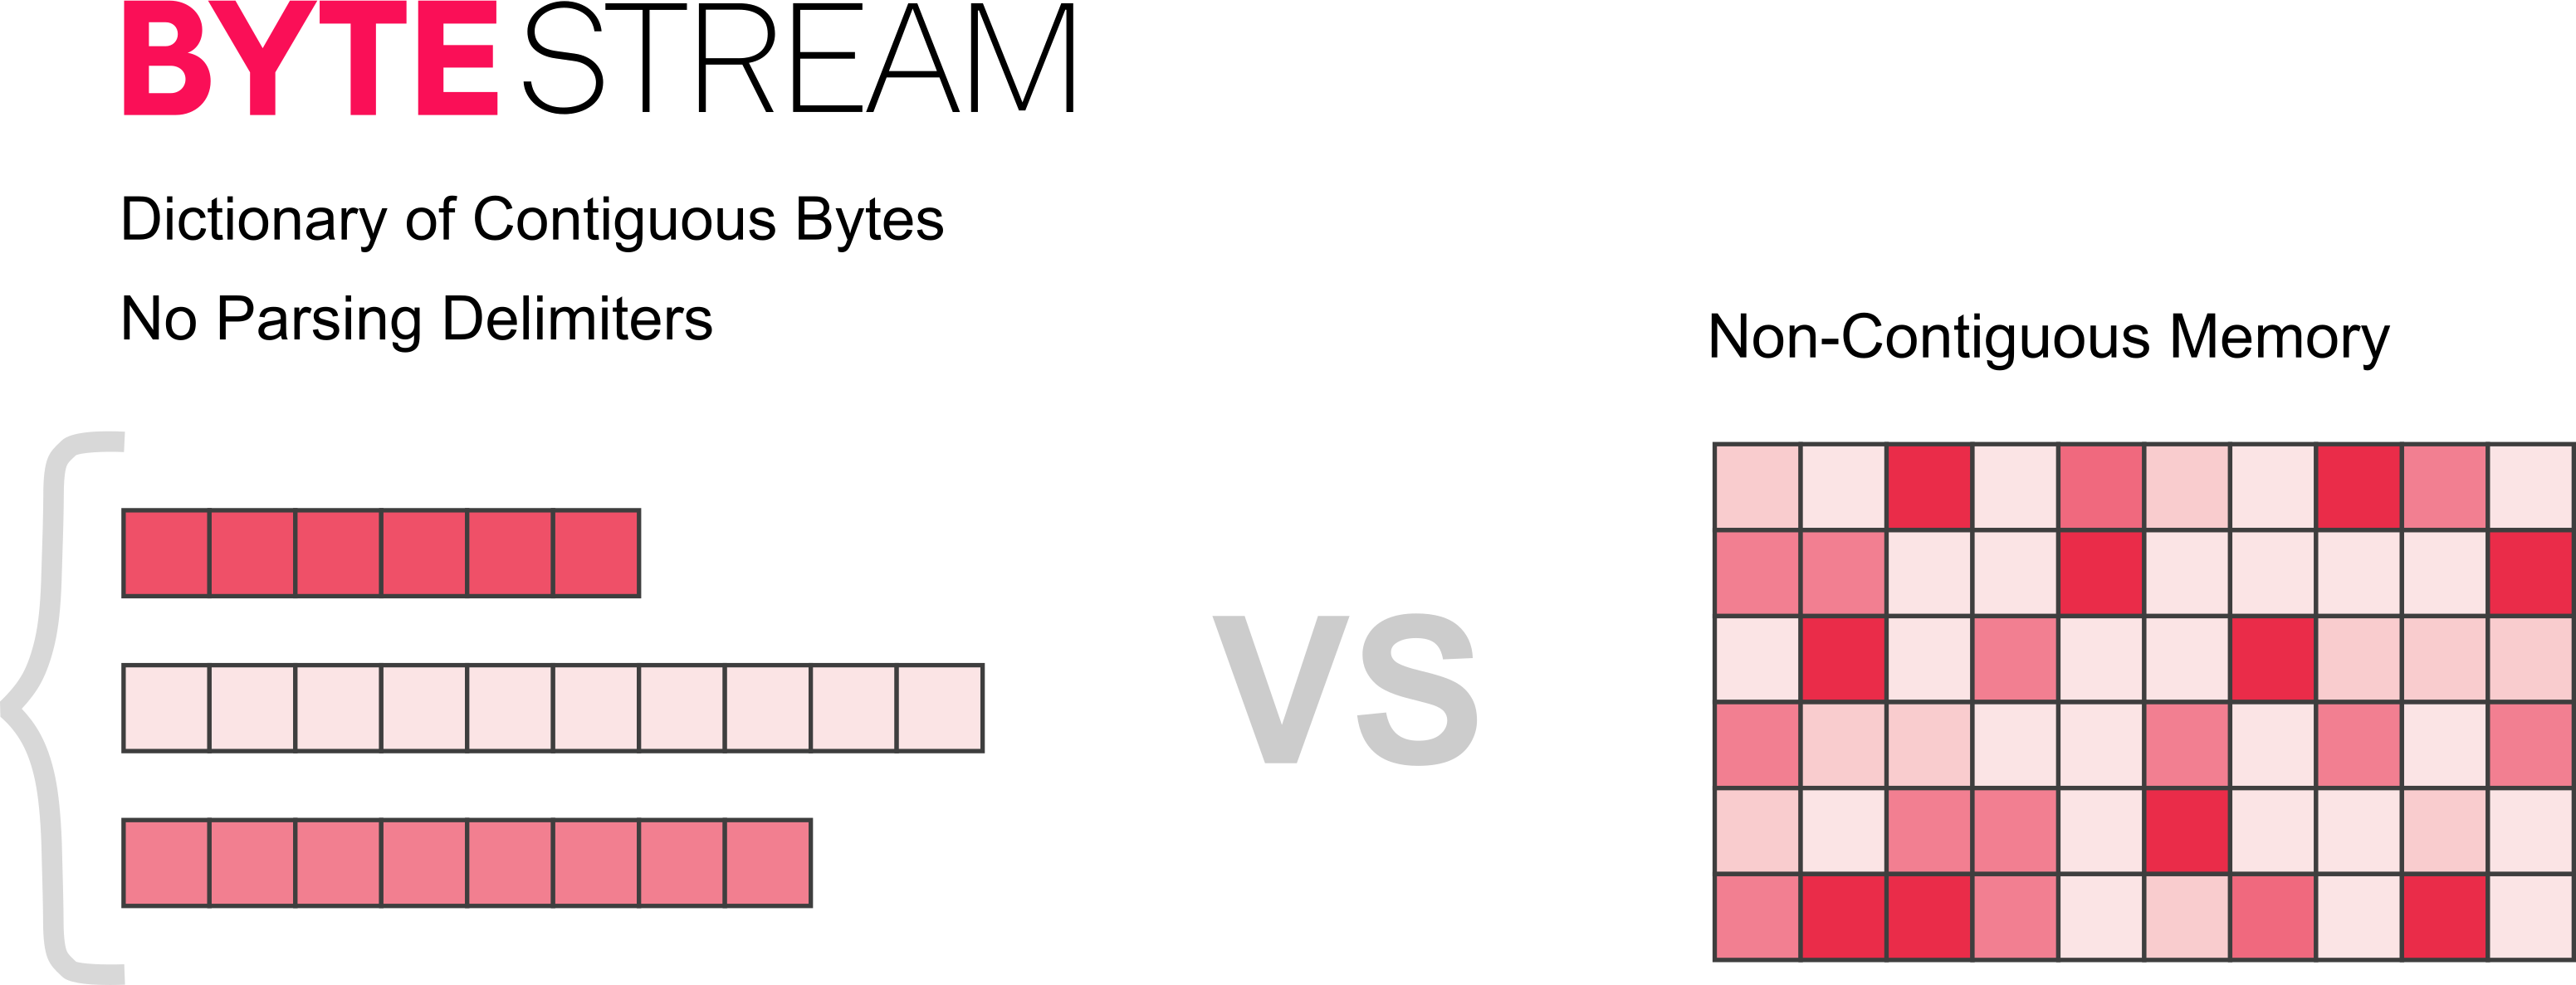
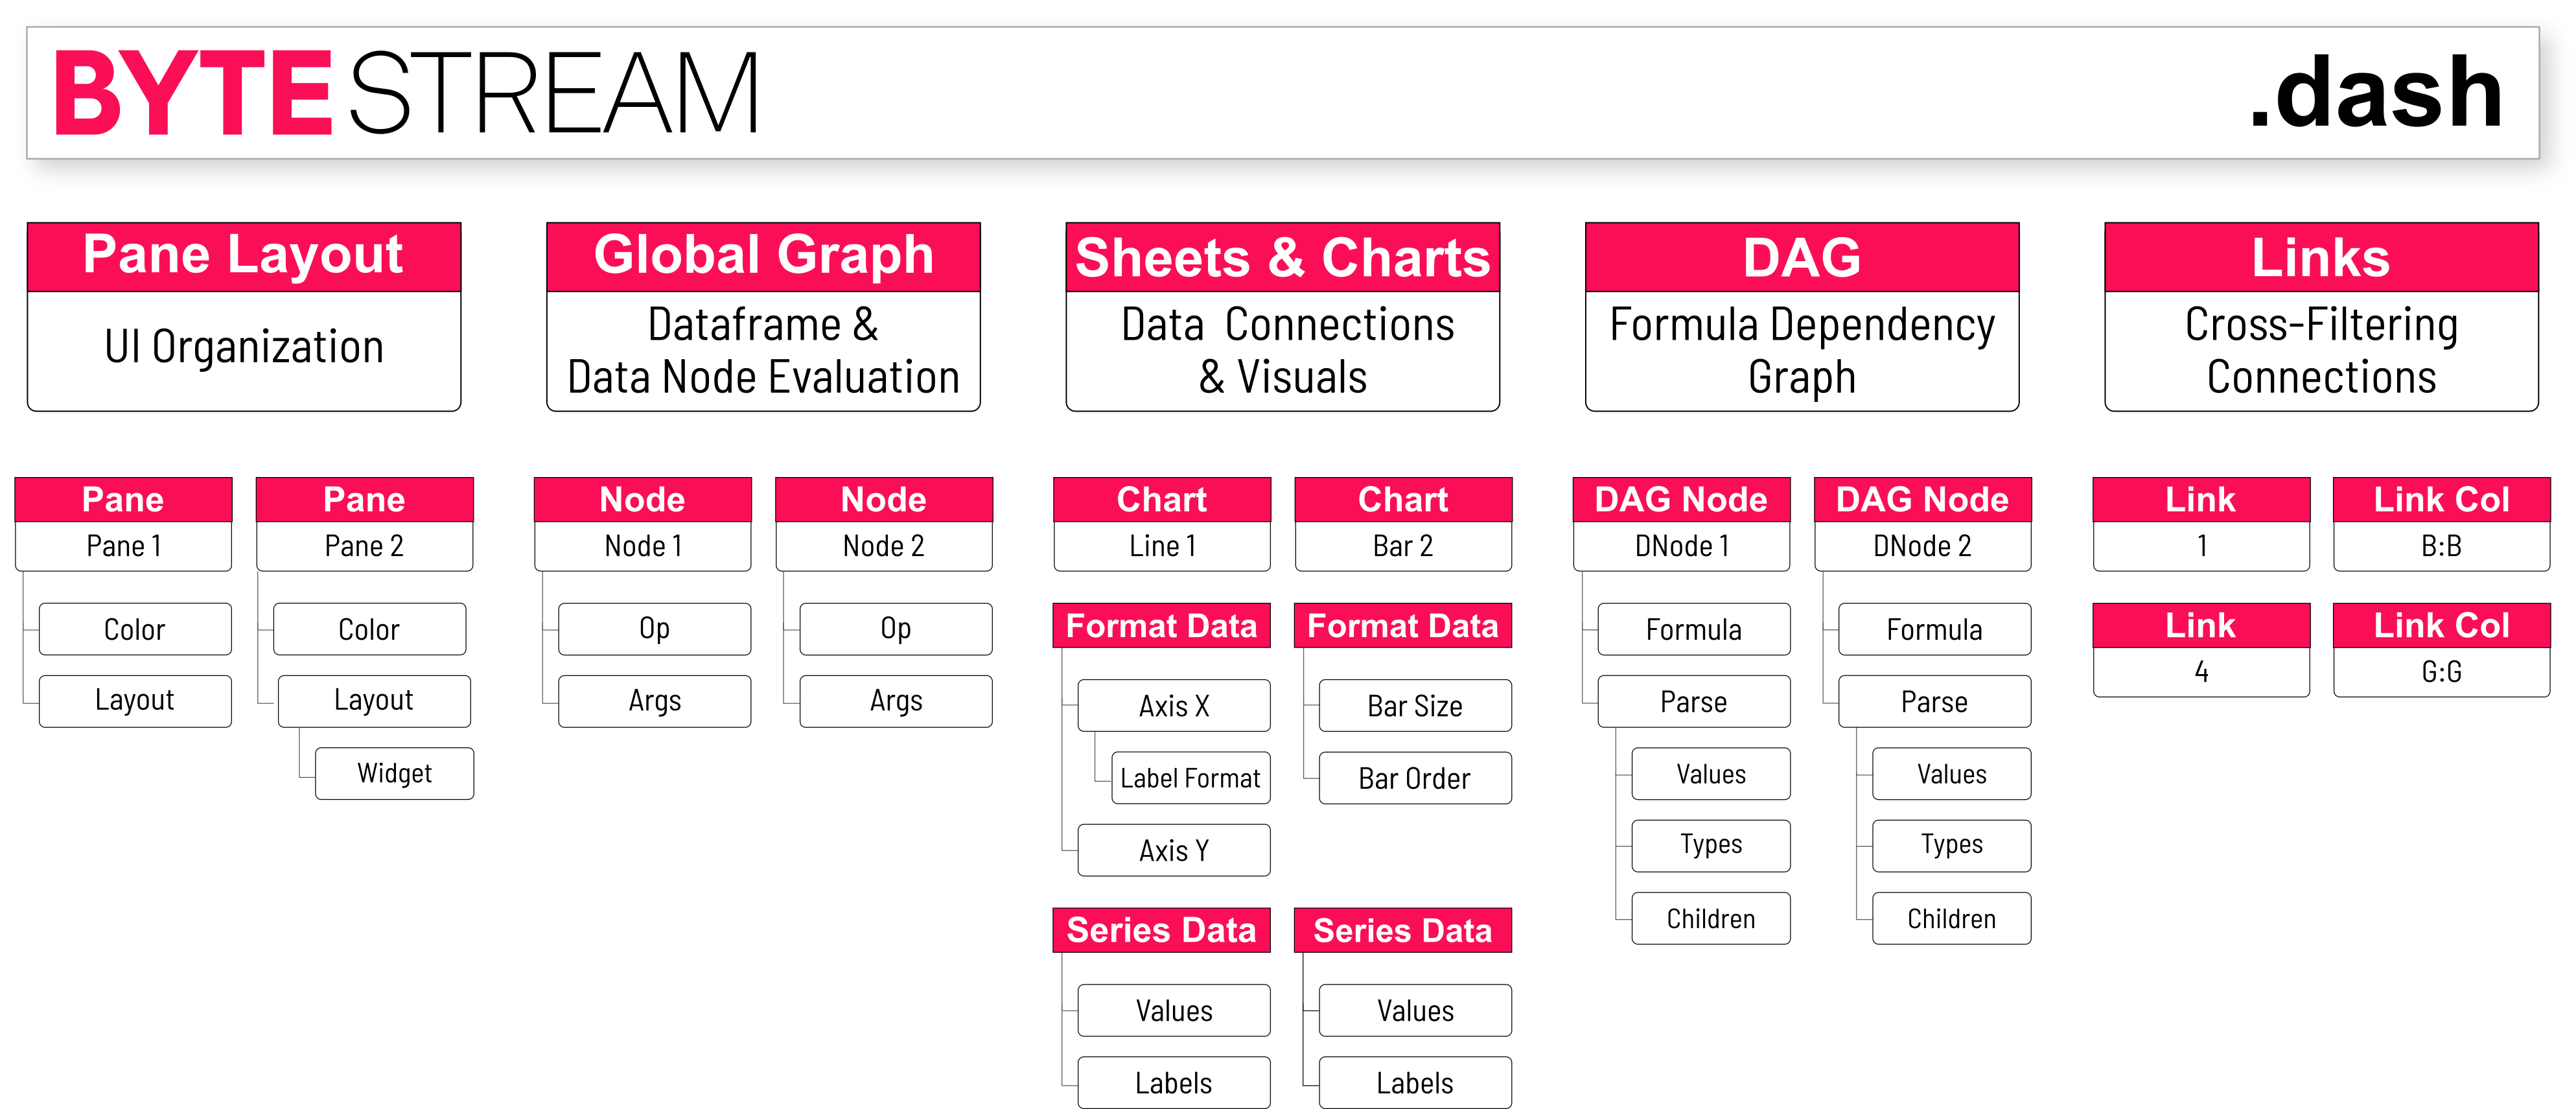
Dashboards are generated and stored in .dash files, which are based on Row64's ByteStream format. You can think of .dash files as a byte tree that describes all configuration aspects of a dashboard. For more information on .dash files, please see the Dashboard Files page.
Configuration Directions
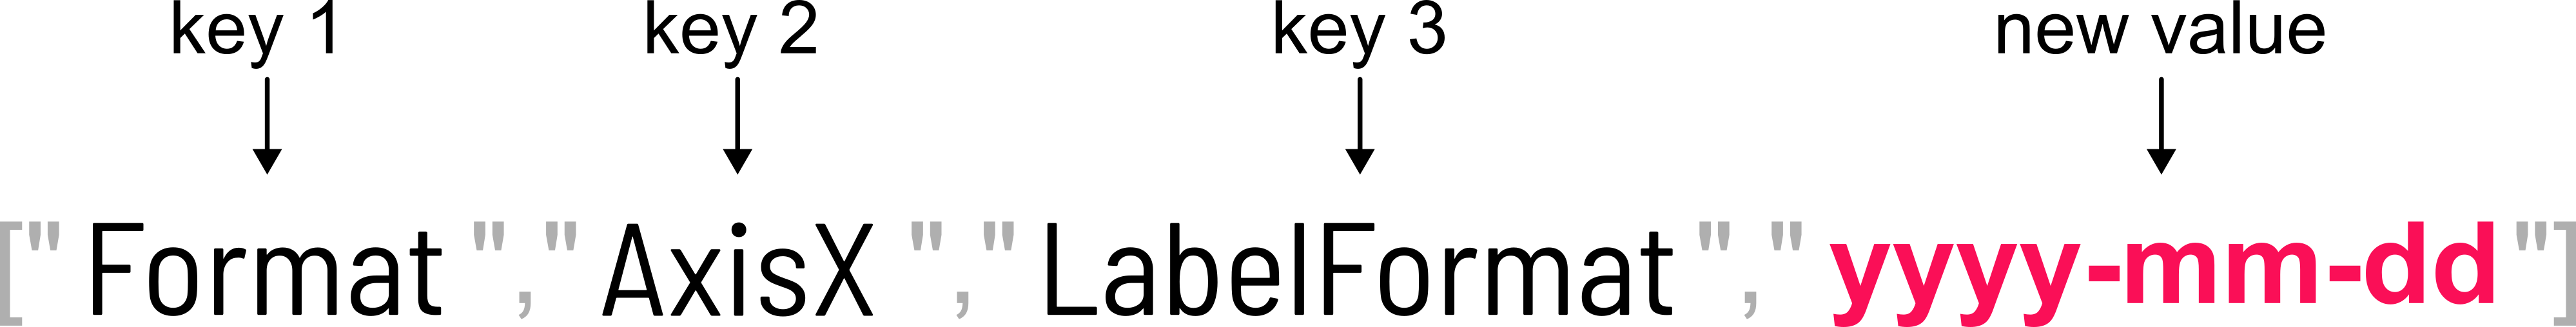
API calls primarily consist of either adding new parts to the configuration tree or modifying an existing value. Setting values is done with a list of directions. For example, a direction may look like:
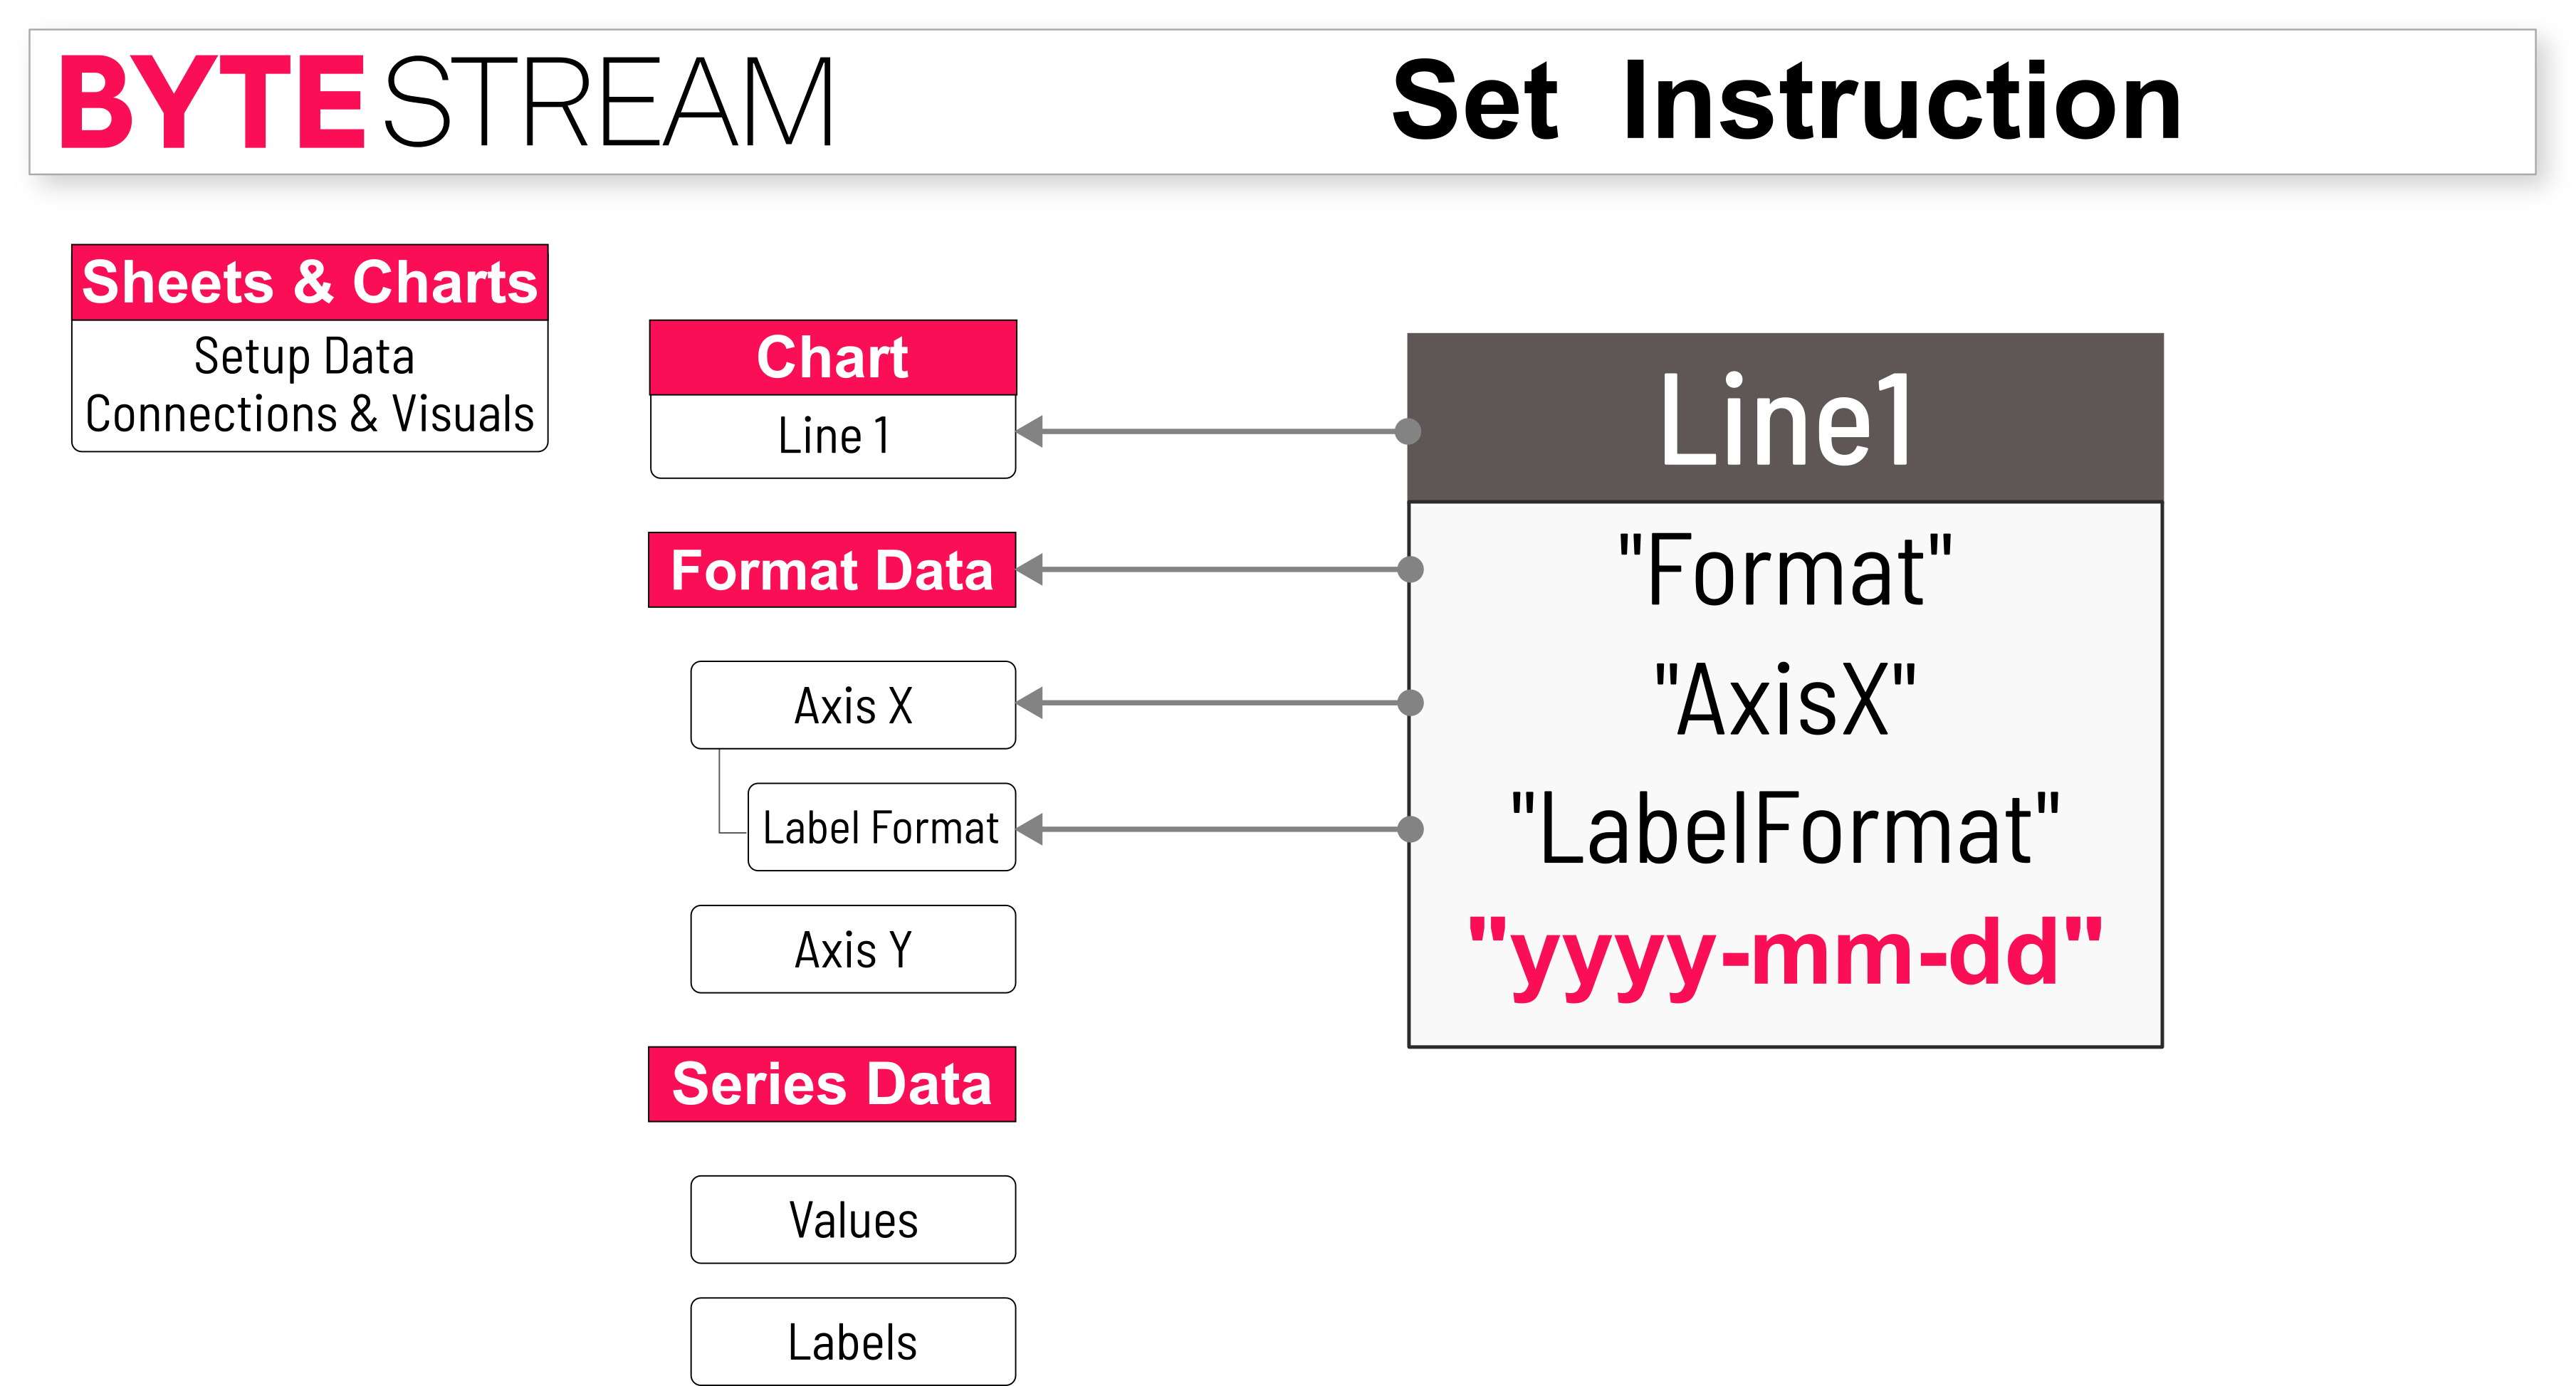
["Format","AxisX","LabelFormat","yyyy-mm-dd"]
This direction sets a line chart format to have the x-axis text formatted as year, month, and date.
Directions provide labels that are used to navigate through the configuration tree to find the targeted variable, and the last value in the direction is the value to set. For instance, continuing the line chart formatting example, the following diagram indicates that the first three values of the direction, being Format, AxisX, and LabelFormat, are keys, whereas the final value, yyyy-mm-dd, is the configuration value to set.
When this direction is set on "Line1" of the targeted line chart, it will walk own the chart's configuration tree using the directions, or keys, and set the value.
Users have the flexibility to either write their own directions, or simply copy and paste pre-made templates from provided examples to achieve the desired results. For a list of examples, please see the DashAPI Examples page.
Installation
The DashAPI is easy to install and included with row64tools. For installation information, please see the DashAPI Installation page. In the examples throughout this section, you will see calls to the DashAPI through row64tools.
Creating and Opening Dashboards
Creating new dashboards and opening existing ones involve different workflows. For example, to create a new dashboard called new_dash.dash, the Python code would be:
from row64tools.dash64 import dash64
dash = dash64("/var/www/dashboards/temp/new_dash.dash")
dash.save()
This code will create a new dashboard, called new_dash.dash, in the /var/www/dashboards/temp/ directory. When creating your own dashboards, you can modify these values as needed. Notice that dash64 is imported from row64tools.
Note
.dash file names need to be lower-case. If you attempt to give a .dash file a name with upper-case characters, the DashAPI will automatically convert the name to lower-case.
The DashAPI supports layouts, or templates. Users can easily place charts and sheets into a layout for a quick dashboard creation and deployment. To learn about using layouts, please see the Dashboard Layout page.
Loading an existing dashboard involves a more complex workflow. For example, a workflow for opening an existing dashboard may resemble the following:
from row64tools.dash64 import dash64
dash = dash64("/var/www/dashboards/temp/new_dash.dash")
dash.load("/var/www/dashboards/temp/bubble.dash")
dash.save()
For a full guide on creating and opening dashboards, please see the Create and Open Dashboards page in this guide.