Combo Box
A combo box is a widget that can be added to dashboard panes. Several types of combo boxes are available:
- Combo box without check marks
- Combo box with check marks
- Combo box with presets and value ranges
- Date range
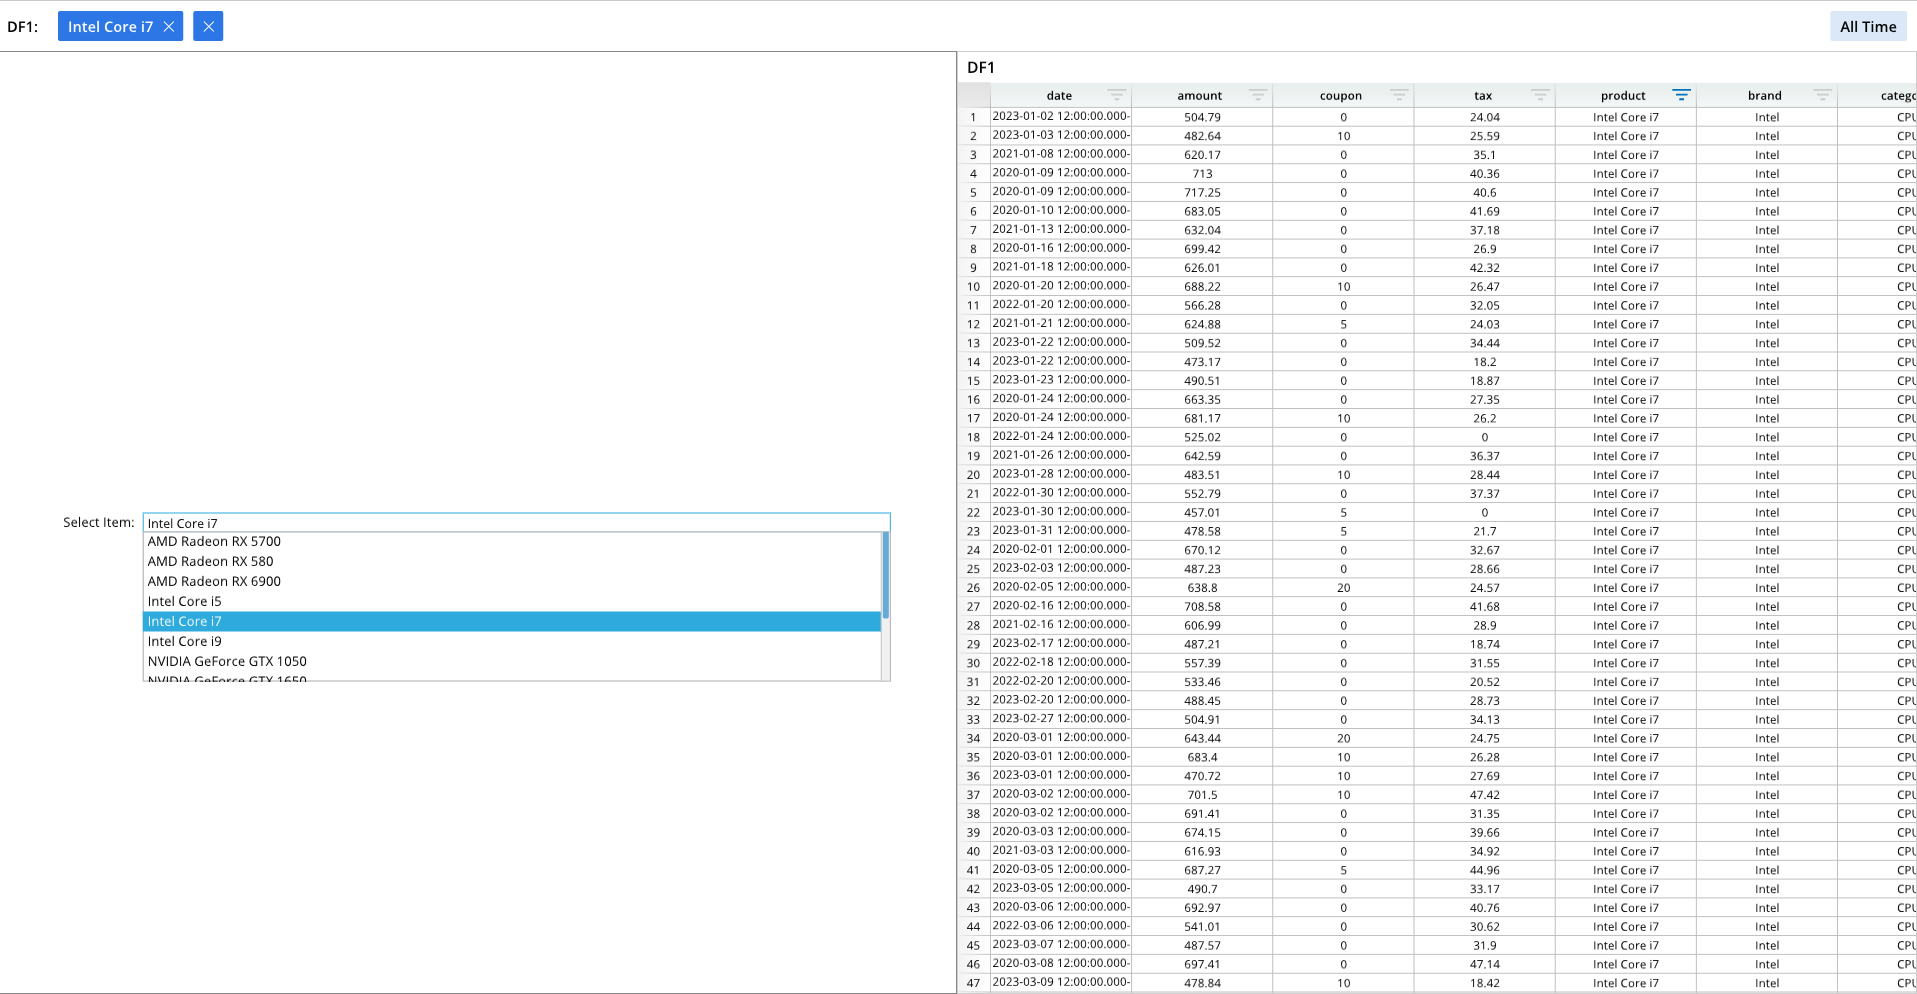
Combo box without check marks:
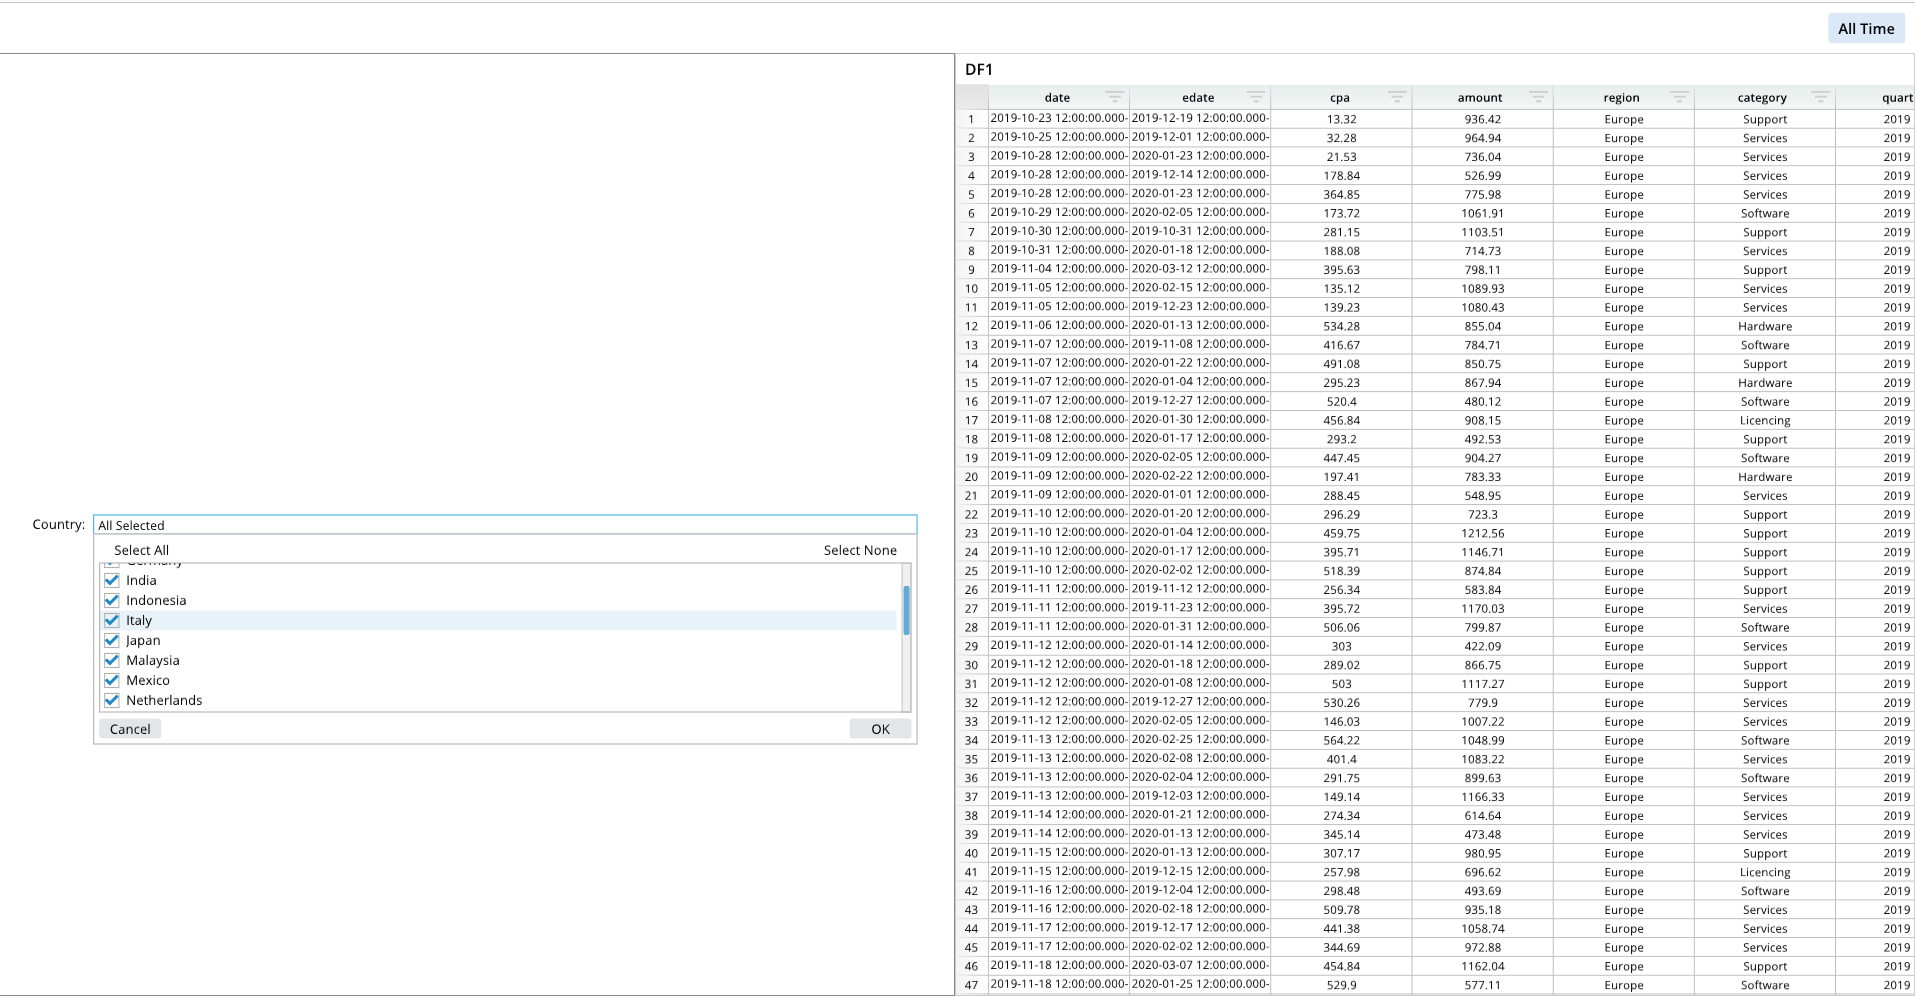
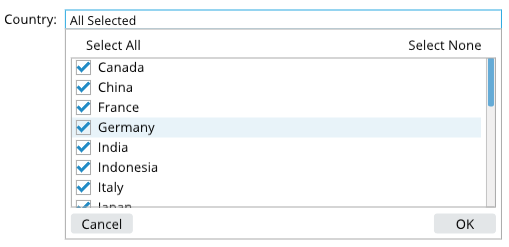
Combo box with check marks:
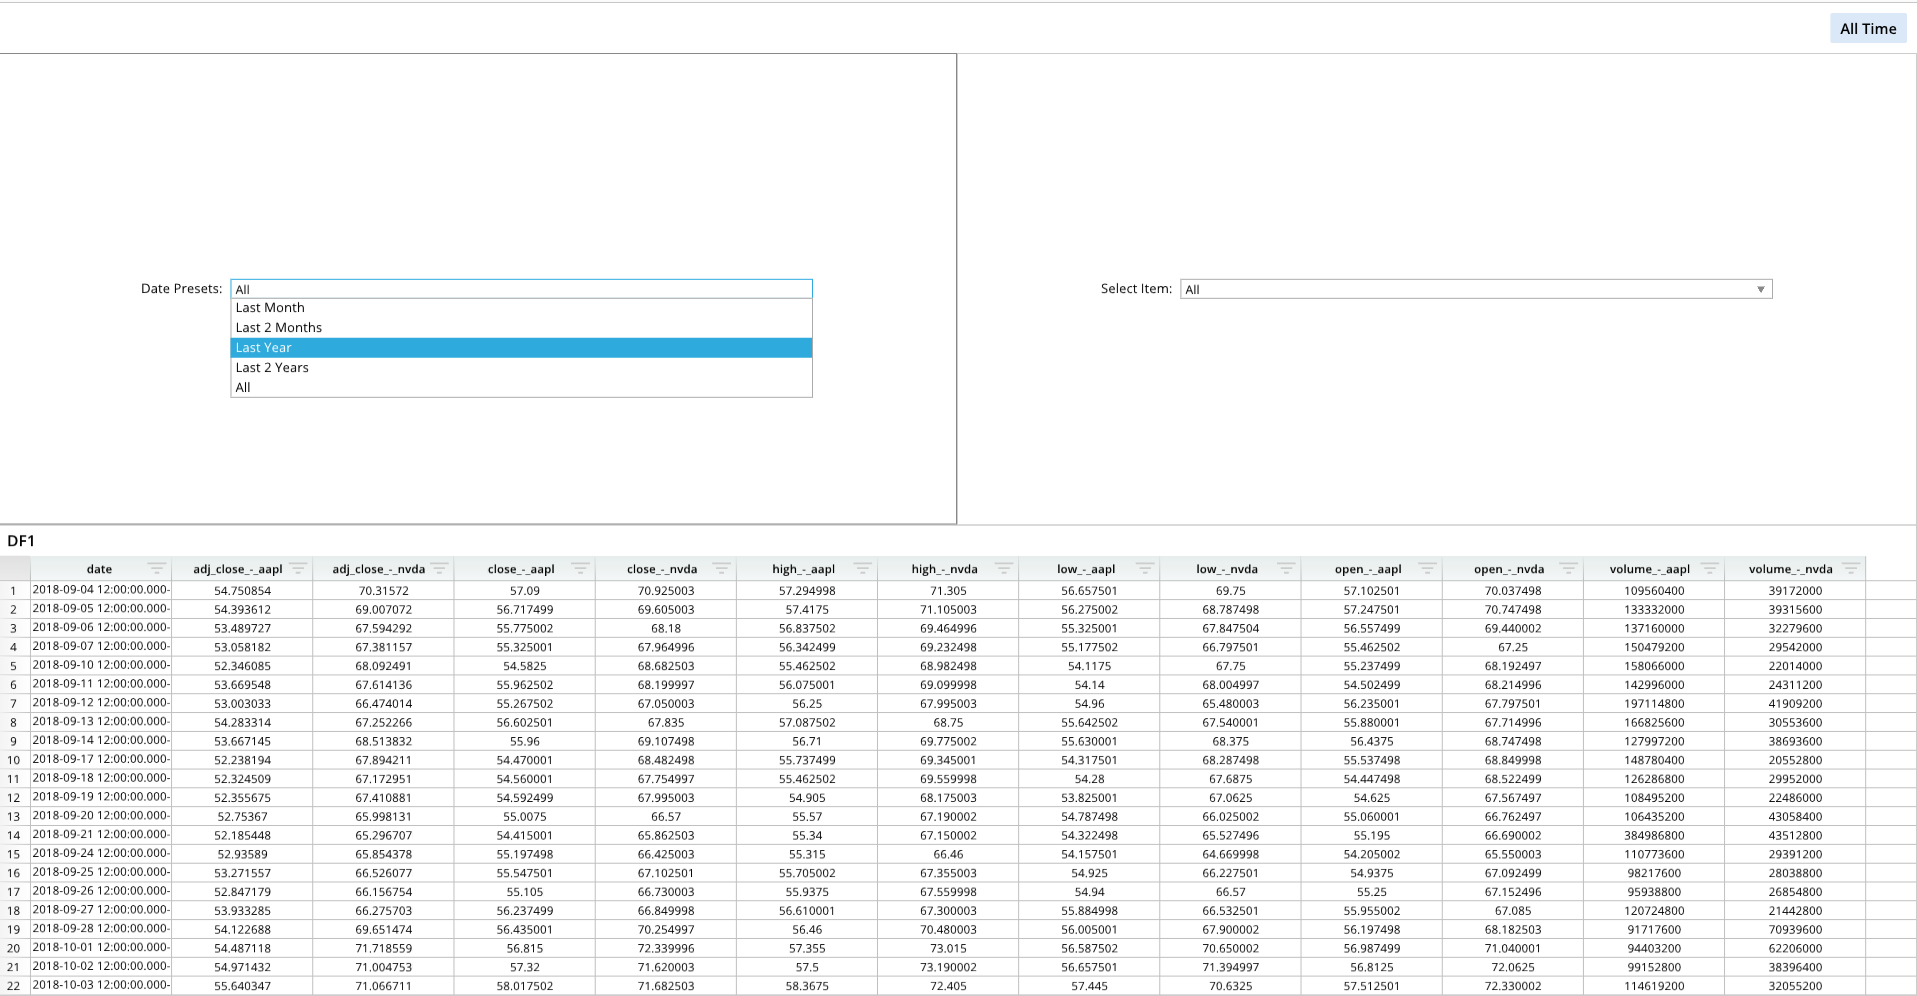
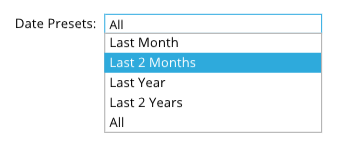
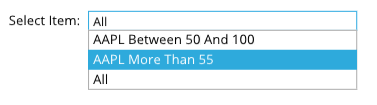
Combo box with presets and value ranges:
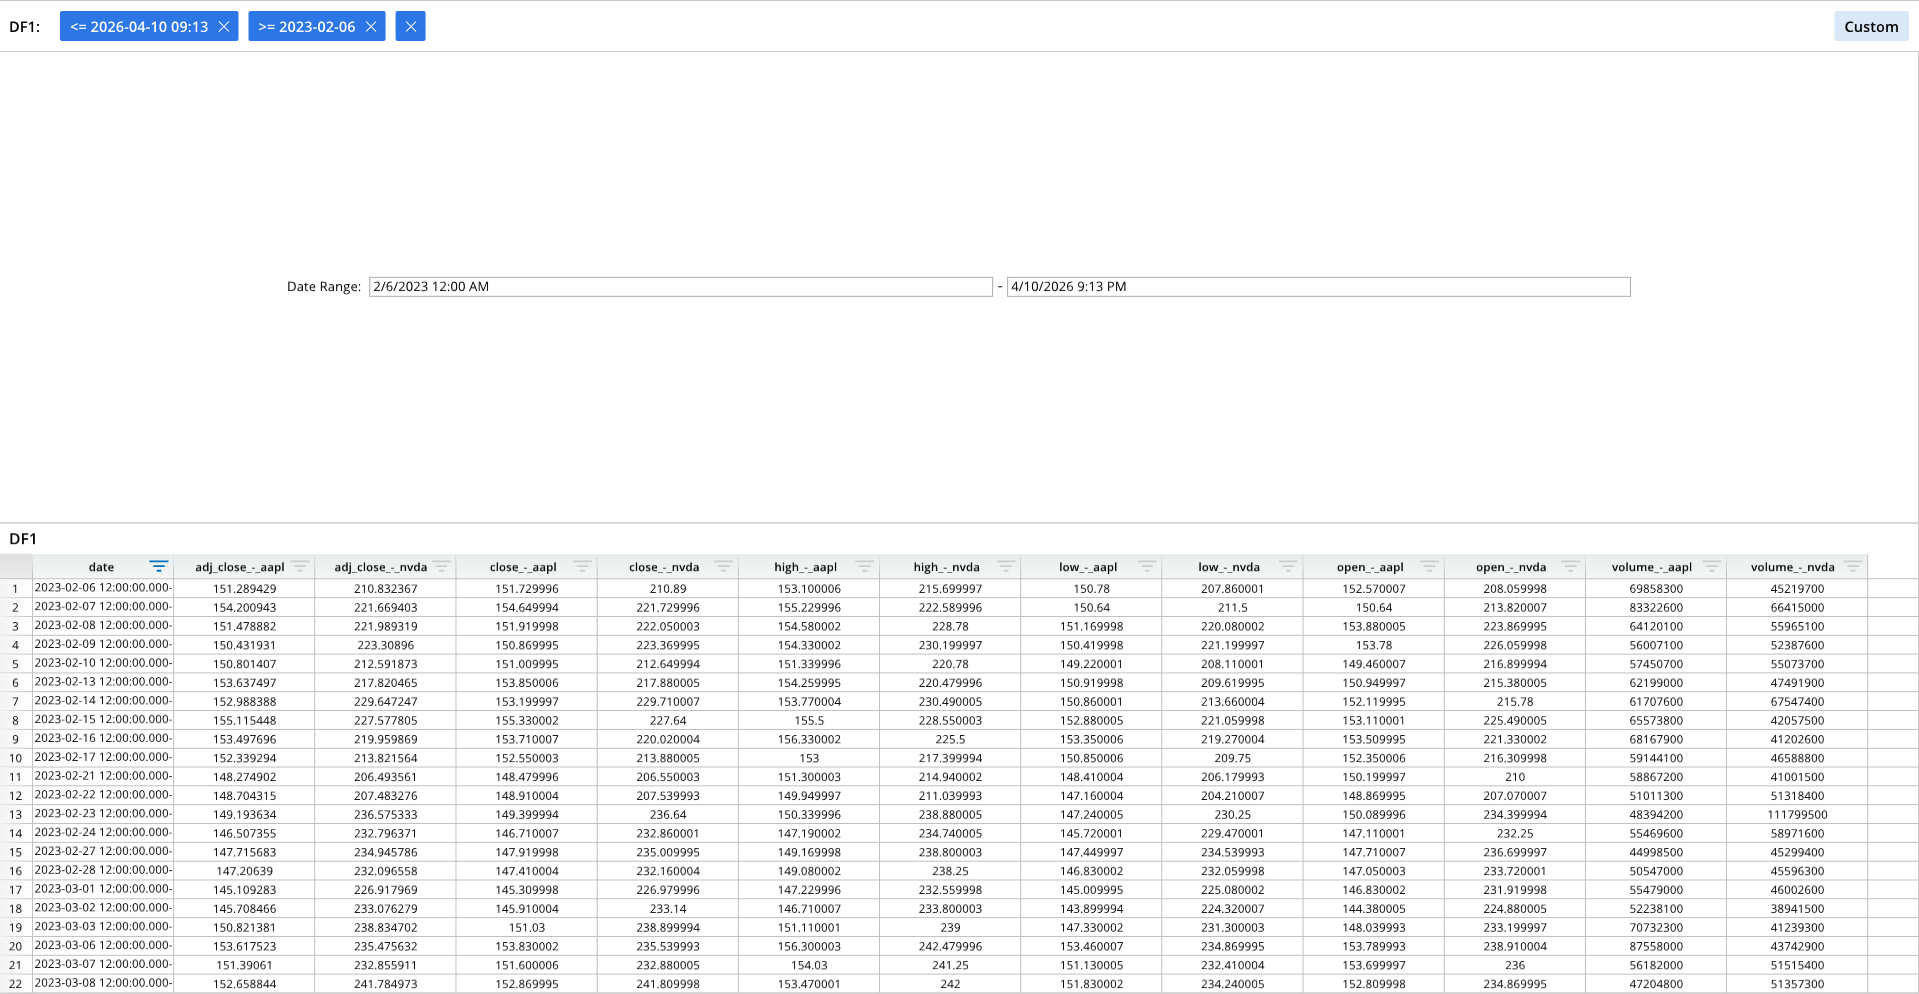
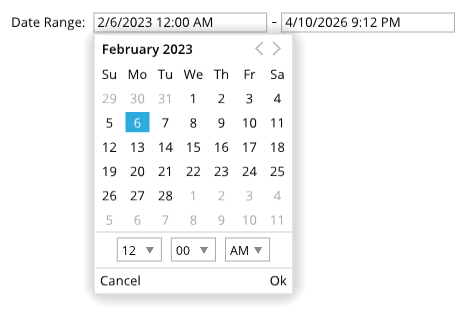
Combo box with date ranges:
Required Components
Adding a combo box to a dashboard pane requires the following components:
wOptions = []- A list that contains formatting options for the combo box, which includes visual formatting and a reference to a dataframe or data node.
dash.add_widget()- A generic function that adds widgets to dashboard panes. The type of widget to add is specified in an argument.
Components Syntax
wOptions
wOptions = [
    ["OPTION_1", VALUE_1],
    ["OPTION_2", VALUE_2],
    ...
]
The wOptions list contains formatting options for the combo box. This list specifies the data range to use for the combo box, and can include visual formatting selections, such as labels and padding. List items contain option names and option values.
For creating a combo box with presets, include the "Grid" format item. The "Grid" item is a list that contains the preset text labels, as well as the necessary formulas to filter the data accordingly. See the Combo box with presets example for more information.
dash.add_widget()
dash.add_widget("WIDGET_TYPE", "PANE_NAME", wOptions)
The dash.add_widget() is a generic function that adds widgets to a dashboard pane. The type of widget to add is specified in an argument.
"WIDGET_TYPE"- The name of the type of widget to add.
"PANE_NAME"- The name of a pane from the pane list (
pList) that the widget should be placed on. The name provided for this argument should match a pane name from the pane list.
- The name of a pane from the pane list (
wOptions- The widget formatting list.
Widget Type Options
Combo widget type options include:
"Combo - Auto Filter""Combo - Column Switcher""Combo - Set Filters""Combo - Value Ranges""Checkbox Combo - Auto Filter"
Code Examples
Combo box without check marks
The following code generates a dashboard with a standard combo box that does not use check marks or presets.
A standard combo box uses the "Combo - Auto Filter" option.
# Module import
from row64tools.dash64 import dash64
dash = dash64("/var/www/dashboards/temp/combo.dash")

# Pane list
pList = [
    ["Dashboard",       "",             "1600",     "900",  "x"],
    ["Left",         "Dashboard",    "*",        "*",    ""],
    ["Right",      "Dashboard",    "*",        "50%",  ""]
]

# Set panes
dash.Layout.set_panes(pList)

# Import a dataframe
dash.add_ramdb("/var/www/ramdb/live/RAMDB.Row64/Examples/HardwareSales.ramdb","DF1")

# Add the dataframe to a pane
dash.add_df("DF1", "Right")

# Widget formatting list
wOptions = [
    ["Label","Select Item:"],
    ["Column","=DF1!E:E"],
    ["Padding",0.23],
    ["Grid",[]]
]

# Add a widget to a pane
dash.add_widget("Combo - Auto Filter", "Left", wOptions)

# Save the dashboard
dash.save()
Combo box with check marks
The following example generates a dashboard that has a combo box with check marks, which can be selected or de-selected to filter the data.
A combo box with check marks uses the "Checkbox Combo - Auto Filter" option.
# Module import
from row64tools.dash64 import dash64

# Dashboard save path
dash = dash64("/var/www/dashboards/temp/checkcombo.dash")

# Pane list
pList = [
    ["Dashboard",       "",             "1600",     "900",  "x"],
    ["Left",         "Dashboard",    "*",        "*",    ""],
    ["Right",      "Dashboard",    "*",        "50%",  ""]
]

# Set panes
dash.Layout.set_panes(pList)

# Import a dataframe
dash.add_ramdb("/var/www/ramdb/live/RAMDB.Row64/Examples/CostPerAcquisition.ramdb","DF1")

# Add the dataframe to a pane
dash.add_df("DF1", "Right")

# Widget options
wOptions = [
    ["Label","Country:"],
    ["Column","=DF1!I:I"],
    ["Padding",0.13],
    ["Grid",[]]
]

# Add the combo box to a pane
dash.add_widget("Checkbox Combo - Auto Filter", "Left", wOptions)

# Save the dashboard
dash.save()
Combo box with presets
The following code generates a dashboard with a combo box, which uses preset values to filter the data. For establishing a list of presets for the combo box, include the "Grid" item in the wOptions list, which is a list of preset labels and formulas. The preset labels define the options in the combo box, and the formulas filter the data.
A combo box with presets uses the "Combo - Value Ranges" option.
# Module import
from row64tools.dash64 import dash64

# Dashboard save path
dash = dash64("/var/www/dashboards/temp/presets.dash")

# Pane list
pList = [
    ["Dashboard",       "",             "1600",     "900",  "y"],
    ["Top",         "Dashboard",    "*",        "*",    "x"],
    ["Bottom",      "Dashboard",    "*",        "50%",  ""],
    ["Left",       "Top",    "*",        "*",    ""],
    ["Right",      "Top",    "*",        "50%",  ""]
]

# Set panes
dash.Layout.set_panes(pList)

# Import a dataframe
dash.add_ramdb("/var/www/ramdb/live/RAMDB.Row64/Examples/MultipleStocks.ramdb","DF1")

# Add the dataframe to a pane
dash.add_df("DF1", "Bottom")

# Options for first combo box, which includes presets
wOptions1 = [
    ["Label","Date Presets:"],
    ["Column","=DF1!A:A"],
    ["Padding",0.5],
    ["Grid",[
            [ "Last Month", "=EDATE(TODAY(),-1)", "=TODAY()" ],
            [ "Last 2 Months", "=EDATE(TODAY(),-2)", "=TODAY()" ],
            [ "Last Year", "=EDATE(TODAY(),-12)", "=TODAY()" ],
            [ "Last 2 Years", "=EDATE(TODAY(),-24)", "=TODAY()" ]
        ]
    ]
]

# Add the first combo box to a pane
dash.add_widget("Date Presets", "Left", wOptions1)

# Options for second combo box, which includes presets
wOptions2 = [
    ["Label","Select Item:"],
    ["Column","=DF1!B:B"],
    ["Padding",0.5],
    ["Grid",[
            ["AAPL Between 50 And 100", "50", "100" ],
            [ "AAPL More Than 55", "55", "" ]
        ]
    ]
]

# Add the second combo box to a pane
dash.add_widget("Combo - Value Ranges", "Right", wOptions2)

# Save the dashboard
dash.save()
Date Range
The following example generates a dashboard a date range combo box. This allows for the data to be filtered by a date range. Similar to a combo box with presets, a "Grid" format option must be included in wOptions with list items.
A date range combo box uses the "Date & Time Range" option.
# Module import
from row64tools.dash64 import dash64

# Dashboard save path
dash = dash64("/var/www/dashboards/temp/drange.dash")

# Pane list
pList = [
    ["Dashboard",       "",             "1600",     "900",  "y"],
    ["Top",         "Dashboard",    "*",        "*",    ""],
    ["Bottom",      "Dashboard",    "*",        "50%",  ""]
]

# Set panes
dash.Layout.set_panes(pList)

# Import a dataframe
dash.add_ramdb("/var/www/ramdb/live/RAMDB.Row64/Examples/MultipleStocks.ramdb","DF1")

# Add the dataframe to a pane
dash.add_df("DF1", "Bottom")

# Widget options list
wOptions1 = [
    ["Label","Date Range:"],
    ["Column","=DF1!A:A"],
    ["Padding",0.5],
    ["Grid",[
            [ "2/6/2023 12:00 AM" ],
            [ "=NOW()" ]
        ]
    ]
]

# Add the widget to a pane
dash.add_widget("Date & Time Range", "Top", wOptions1)

# Save the dashboard
dash.save()