Multi-Spreadsheet
The DashAPI can add multiple spreadsheets to a dashboard.
For information on adding only a single spreadsheet to a dashboard, please see the Spreadsheet page.
Required Components
Adding multiple spreadsheets to a dashboard involves the same components as adding a single spreadsheet to a dashboard:
ssDef = []- A list that defines the content of the spreadsheet.
- This list can include text fromat codes to format the visual appearance of text in cells.
dim = []- A list that determines the structure of the spreadsheet. This list establishes the row and column count, as well as the focus or crop area.
dash.add_spreadsheet()- The function that places the spreadsheet on a designated pane.
Components Syntax
The components for adding multiple spreadsheets to a dashboard are the same as the components needed to add a single spreadsheet:
ssDef = []dim = []dash.add_spreadsheet()
For detailed information on the syntaxes of each of these components, please see the Components Syntax section of the Spreadsheet (single) page.
Adding Multiple Spreadsheets
When adding multiple spreadsheets, you must use additional instances of the ssDef and dim lists. For example, if a dashboard needed to display two spreadsheets, the first spreadsheet could be defined with:
ssDefdim
And the second spreadsheet could be defined with:
ssDef2dim2
The ssDef and dim lists can have any name and don't have to conform to the names in this document verbatim. What matters is that these lists are passed into the correct locations in the dash.add_spreadsheet() function.
To add multiple spreadsheets to a dashboard, simply use multiple instances of the dash.add_spreadsheet() function.
For example, if the two sets of lists referenced above format two separate spreadsheets, you would use two instances of the dash.add_spreadsheet() function to pass these lists to the dashboard, while also giving the spreadsheets different names and assigning them to different dashboard panes:
...

dash.add_spreadsheet("Sheet1",ssDim, ssDef,"TopPane")

...

dash.add_spreadsheet("Sheet2",ssDim2, ssDef2,"BottomPane")

...
Code Example
# Module import
from row64tools.dash64 import dash64

# Dashboard save path
dash = dash64("/var/www/dashboards/temp/linkss.dash")

# Establish dashboard panes
pList = [
    ["Main",            "",             "1600",     "900",  "y"],
    ["TopPane",         "Main",         "*",        "*",    ""],
    ["BottomPane",      "Main",         "*",        "*",    ""]
]
dash.Layout.set_panes(pList)

# Spreadsheet definition list 1
ssDef = [
    ["A1",    "Project 1","BIC4a89e7OFFFFFF" ,"#,###.00"],
    ["B1",    None,"BC4a89e7"],
    ["C1",    "SHEET 1","H3BC4a89e7OFFFFFF"],
    ["A2",    "Expense 1"],
    ["B2",    "510.10"],
    ["A3",    "Expense 2"],
    ["B3",    "46.80",""],
    ["A4",    "TOTAL:","B"],
    ["B4",    "=SUM(B2:B3)","B","#,###.00"]
]

# Spreadsheet dimensions list 1
ssDim = [0, 0, 2, 4]

# Add the first spreadsheet to a pane
dash.add_spreadsheet("Sheet1",ssDim, ssDef,"TopPane")

# Spreadsheet definition list 2
ssDef2 = [
    ["A1",    "Expense Summary","BIC1844857OFFFFFF" ,"#,###.00"],
    ["B1",    None,"BC184485OFFFFFF"],
    ["C1",    "SHEET 2","H3BC184485OFFFFFF"],
    ["A2",    "Project 1:"],
    ["B2",    "=Sheet1!B4", "","#,###.00"],
    ["A3",    "Project 2:"],
    ["B3",    "12521", "","#,###.00","12,521.00"],
    ["A4",    "TOTAL:","B"],
    ["B4",    "=SUM(B2:B3)","B","#,###.00"]
]

# Spreadsheet dimensions list 2
ssDim2 = [0, 0, 2, 4]

# Add the second spreadsheet to a pane
dash.add_spreadsheet("Sheet2",ssDim2, ssDef2,"BottomPane")

# Save the dashboard
dash.save()
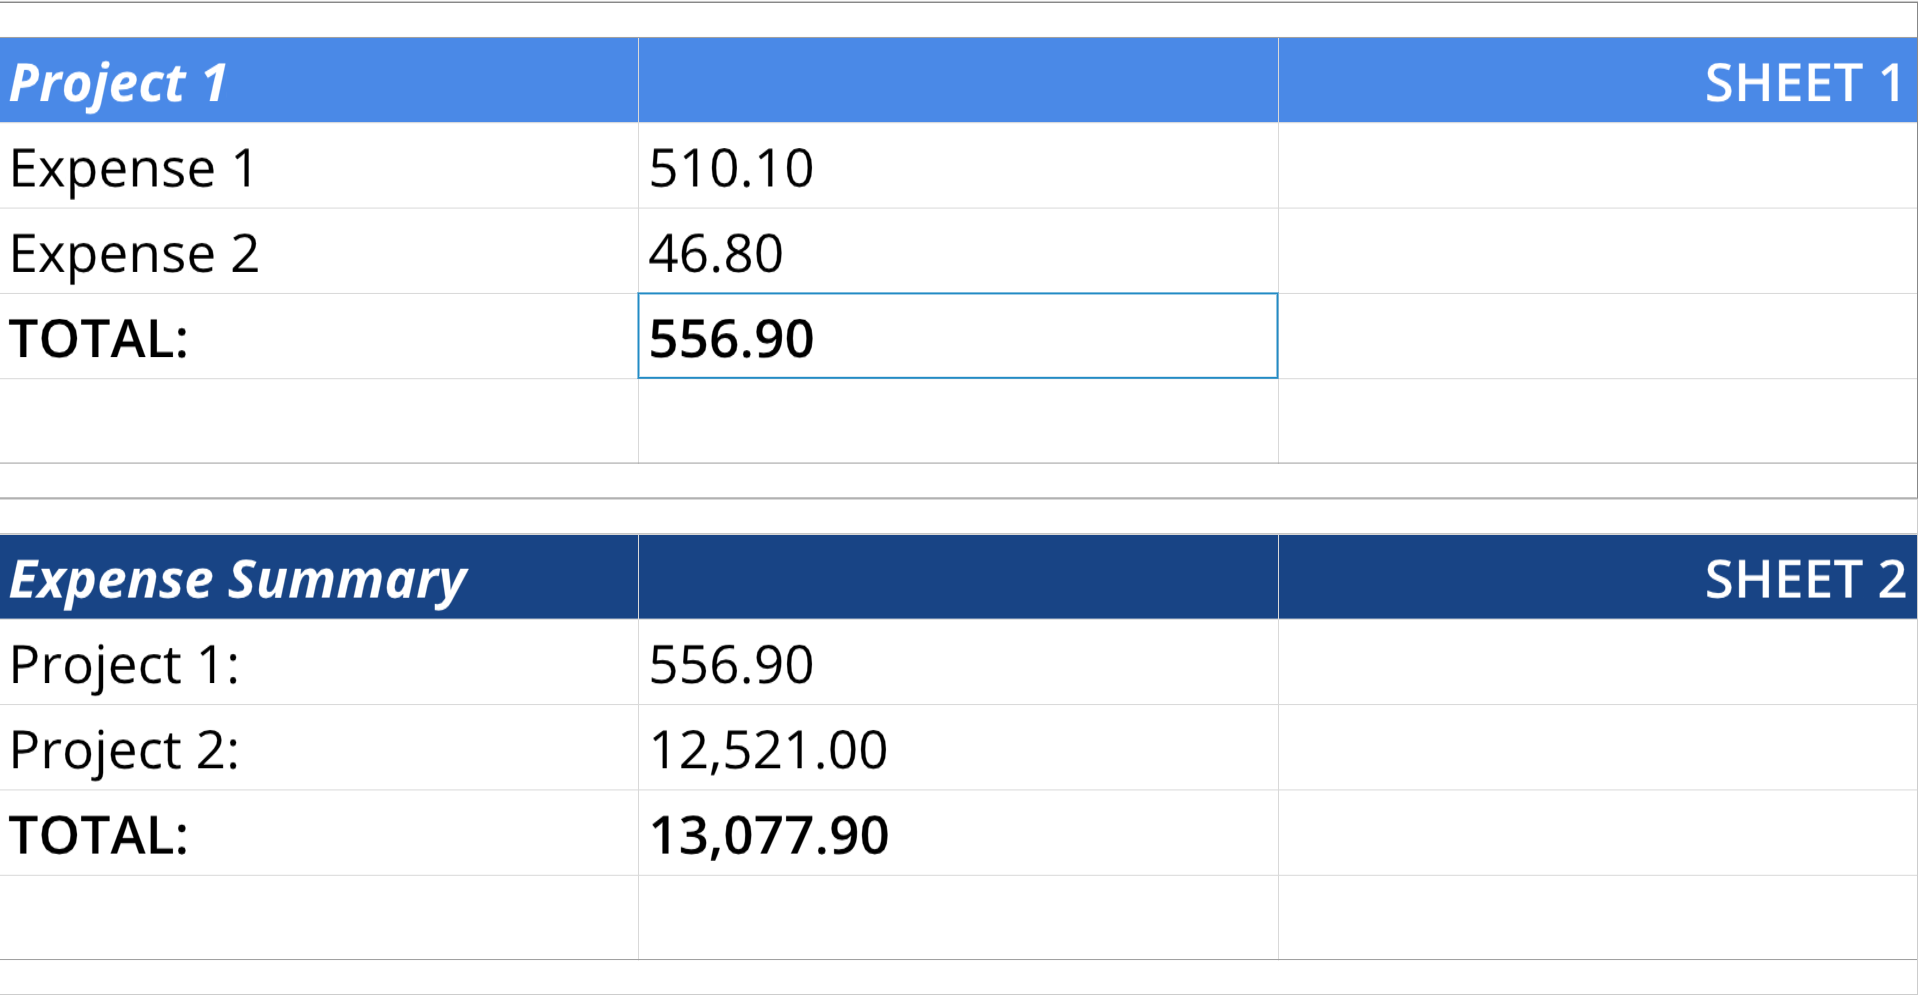
The two spreadsheets in this example use linked equations. In the code for the second spreadsheet, cell B2 makes a reference to cell B4 from Sheet 1. To learn more about using linked equations, please see the Linked Equations page.