Spreadsheet Summary of a Dataframe
A spreadsheet can be used to summarize and perform calculations on the contents of a dataframe.
Required Components
Adding a spreadsheet based on a dataframe involves the same components as adding a single or multiple spreadsheets to a dashboard:
ssDef = []- A list that defines the content of the spreadsheet.
- This list can include text fromat codes to format the visual appearance of text in cells.
dim = []- A list that determines the structure of the spreadsheet. This list establishes the row and column count, as well as the focus or crop area.
dash.add_spreadsheet()- The function that places the spreadsheet on a designated pane.
Components Syntax
The components for adding a spreadsheet based on a dataframe are the same as the components needed to add a single or multiple spreadsheets:
ssDef = []dim = []dash.add_spreadsheet()
For detailed information on the syntaxes of each of these components, please see the Components Syntax section of the Spreadsheet (single) page.
Linking a Spreadsheet to a Dataframe
For linking a spreadsheet to a dataframe, you must first include DashAPI code to add a dataframe by using the dash.add_ramdb() to include a dataframe in the dashboard, and optionally the dash.add_df() function to add the dataframe to a dashboard pane. It is not required to have the dataframe on a dashboard pane to reference it.
With a dataframe established, the ssDef list is needed to build the content of the spreadsheet. Each list item within the ssDef list assigns content and optional formatting to a cell in the spreadsheet. The content field of an ssDef item can be a static value, a reference to another spreadsheet, or a reference to a dataframe.
Referencing a dataframe is very similar to using linked equations to reference cells between different spreadsheets. To reference a dataframe, simply provide the dataframe reference in the content field of an ssDef list item.
A dataframe reference, like a linked equation, uses the following syntax:
DATAFRAME_NAME!CELL_REFERENCE
DATAFRAME_NAME- The DATAFRAME_NAME is the name of the dataframe, which is the second argument in the
dash.add_ramdb()function. - When adding a dataframe with the
dash.add_ramdb()function, the first argument is the file path of the dataframe, and the second argument is the user-defined name for the dataframe. - For instance, many of the examples in this documentation, including in this article, assign
DF1as the name for the first or only dataframe.
- The DATAFRAME_NAME is the name of the dataframe, which is the second argument in the
CELL_REFERENCE- A reference to a cell or range in the dataframe.
- The cell reference should be in A1 notation.
- Example:
B2 - Exampel:
D:D
The following is an example of a reference to a dataframe, called DF, in the ssDef list:
ssDef = [
    ...
    ["B4","Coupons:"],["C4","=SUM(DF1!C:C)","","#,###.00"],
    ...
]
In this example, cell C4 of the spreadsheet is summing the entirety of the C column of dataframe DF1. This cell also applies number formatting to round the result of the summation to two decimal places.
To learn more about the syntax of the ssDef list, please see the Components Syntax section of the Spreadsheet page.
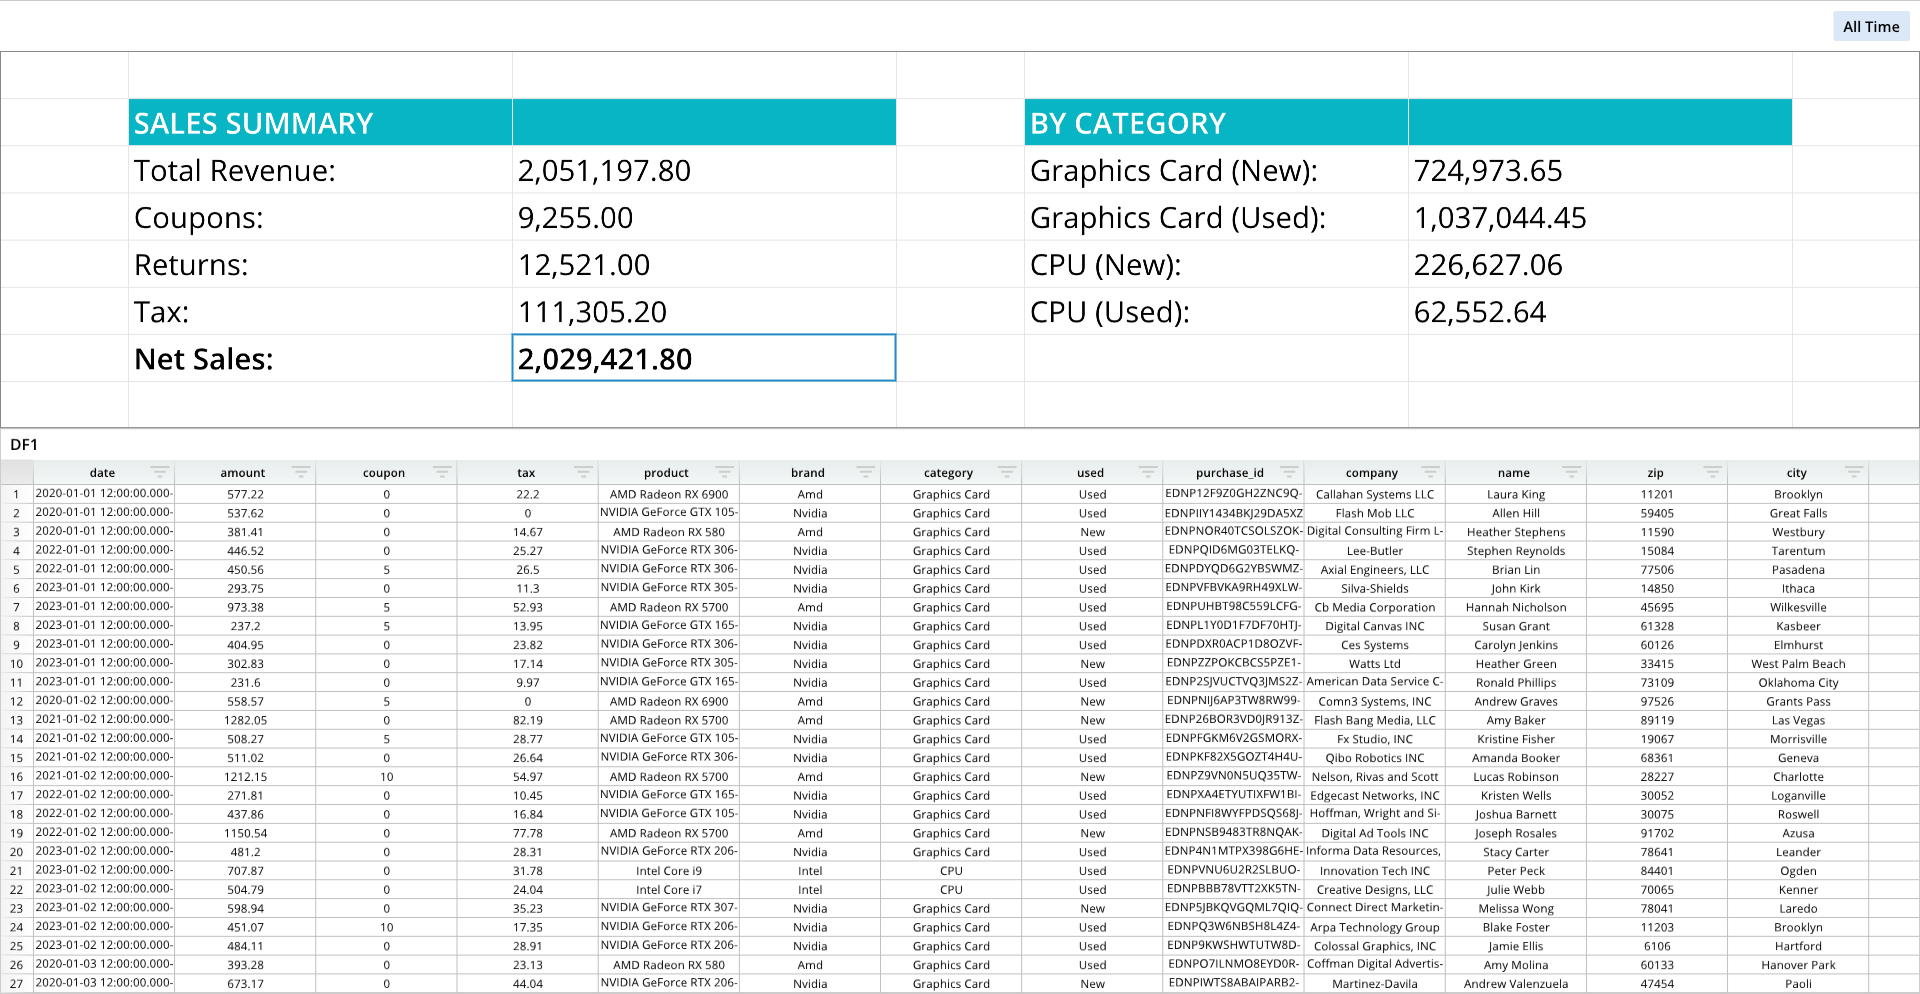
Code Example
The following example creates a small spreadsheet that uses SUM() formulas on columns in a dataframe, named DF1.
# Module import
from row64tools.dash64 import dash64

# Dashboard save path
dash = dash64("/var/www/dashboards/temp/dfss.dash")

# Pane list
pList = [
    ["Main",            "",             "1600",     "900",  "y"],
    ["TopPane",         "Main",         "*",        "40%",  ""],
    ["BottomPane",      "Main",         "*",        "60%",  ""]
]

# Set panes
dash.Layout.set_panes(pList)

# Load and name a dataframe
dash.add_ramdb("/var/www/ramdb/live/RAMDB.Row64/Examples/HardwareSales.ramdb","DF1")

# Set dataframe on a dashboard pane
dash.add_df("DF1", "BottomPane")

# Spreadsheet definition list
ssDef = [
    ["B2","SALES SUMMARY","BC08b5c5OFFFFFF"],["C2","","BC08b5c5"],
    ["B3","Total Revenue:"],["C3","=SUM(DF1!B:B)","","#,###.00"],
    ["B4","Coupons:"],["C4","=SUM(DF1!C:C)","","#,###.00"],
    ["B5","Returns:"],["C5","12521", "","#,###.00","12,521.00"],
    ["B6","Tax:"],["C6","=SUM(DF1!D:D)","","#,###.00"],
    ["B7","Net Sales:","B"],["C7","=C3-C4-C5","B","#,###.00"],
    ["E2","BY CATEGORY","BC08b5c5OFFFFFF"],["F2","","BC08b5c5"],
    ["E3","Graphics Card (New):"],["F3","=SUMIFS(DF1!B:B,DF1!G:G,\"Graphics Card\",DF1!H:H,\"New\")","","#,###.00"],
    ["E4","Graphics Card (Used):"],["F4","=SUMIFS(DF1!B:B,DF1!G:G,\"Graphics Card\",DF1!H:H,\"Used\")","","#,###.00"],
    ["E5","CPU (New):"],["F5","=SUMIFS(DF1!B:B,DF1!G:G,\"CPU\",DF1!H:H,\"New\")","","#,###.00"],
    ["E6","CPU (Used):"],["F6","=SUMIFS(DF1!B:B,DF1!G:G,\"CPU\",DF1!H:H,\"Used\")","","#,###.00"]
]

# Spreadsheet dimensions list
ssDim = [0, 0, 6, 7]

# Add the spreadsheet to a dashboard pane
dash.add_spreadsheet("Sheet1",ssDim, ssDef,"TopPane")

# Additional spreadsheet formatting
cWidths = dash.Sheets.Items[ dash.Sheets.get_sheet_ind("Sheet1") ].ColumnWidths
for i, w in zip([0,3,6],[50,50,50]):cWidths[i] = w # widen columns
paneDef = [["Layout","Fit", 2]] # 0 = no fit, 1 = fit to pane, 2 = stretch to pane
dash.set_pane_def( "TopPane", paneDef)

# Save the dashboard
dash.save()