Pie Chart
Required Components
Adding a pie chart requires the following components:
pDef = []- A list that establishes the chart's name, labels, and values, based on the underlying dataframe or data node.
pOptions = []- A list of format options that changes the visual appearance of the chart.
dash.add_wordcloud()- The function that places the chart on a designated pane. The structure and formatting lists are passed into this function.
Note that the definition and options lists are simply Python lists and that their variable names can change.
Components Syntax
pDef
pDef = [[ "NAME", "LABELS", "VALUES" ] ]
The pDef ("pie definition") list establishes the chart's overall structure by defining the series' name, chart labels, and values.
"NAME"- A string value that gives a name to the series.
"LABELS"- Defines the labels on the chart, which can be a list or cell reference.
- Example:
"=DNode2!A:A"
"VALUES"- The range of values from the underlying data table.
- Example:
"=DF1!H:H"
pOptions
pOptions = [
    ["Details", "ColorTheme",[0xaf4425,0x662e1c,0xc9a66b,0xebdcb2]],
    ["Details","ShowTitle",True],
    ["Details","Title","Market Share"],
    ...
]
The pOptions list is a list of formatting options that changes the appearance of the chart. Each formatting item is enclosed in brackets [ ... ] and separated by commas. A full list of formatting options is available in the Pie Chart Format Options section.
dash.add_pie()
dash.add_pie("CHART_NAME", "PANE_NAME", pDef, pOptions)
The dash.add_pie() function adds the chart to a designated dashboard pane. This function takes the chart's name, the destination pane's name, and the definition and formatting lists as arguments.
"CHART_NAME"- The name you want to give the chart.
"PANE_NAME"- The name of a pane from the pane list (
pList) that the chart should be placed on. The name provided for this argument should match a pane name from the pane list.
- The name of a pane from the pane list (
wDef- The definition list, which defines the chart's title, words, frequencies, and sentiments
wOptions- The options list, which defines the chart's visual appearance and formatting.
Code Example
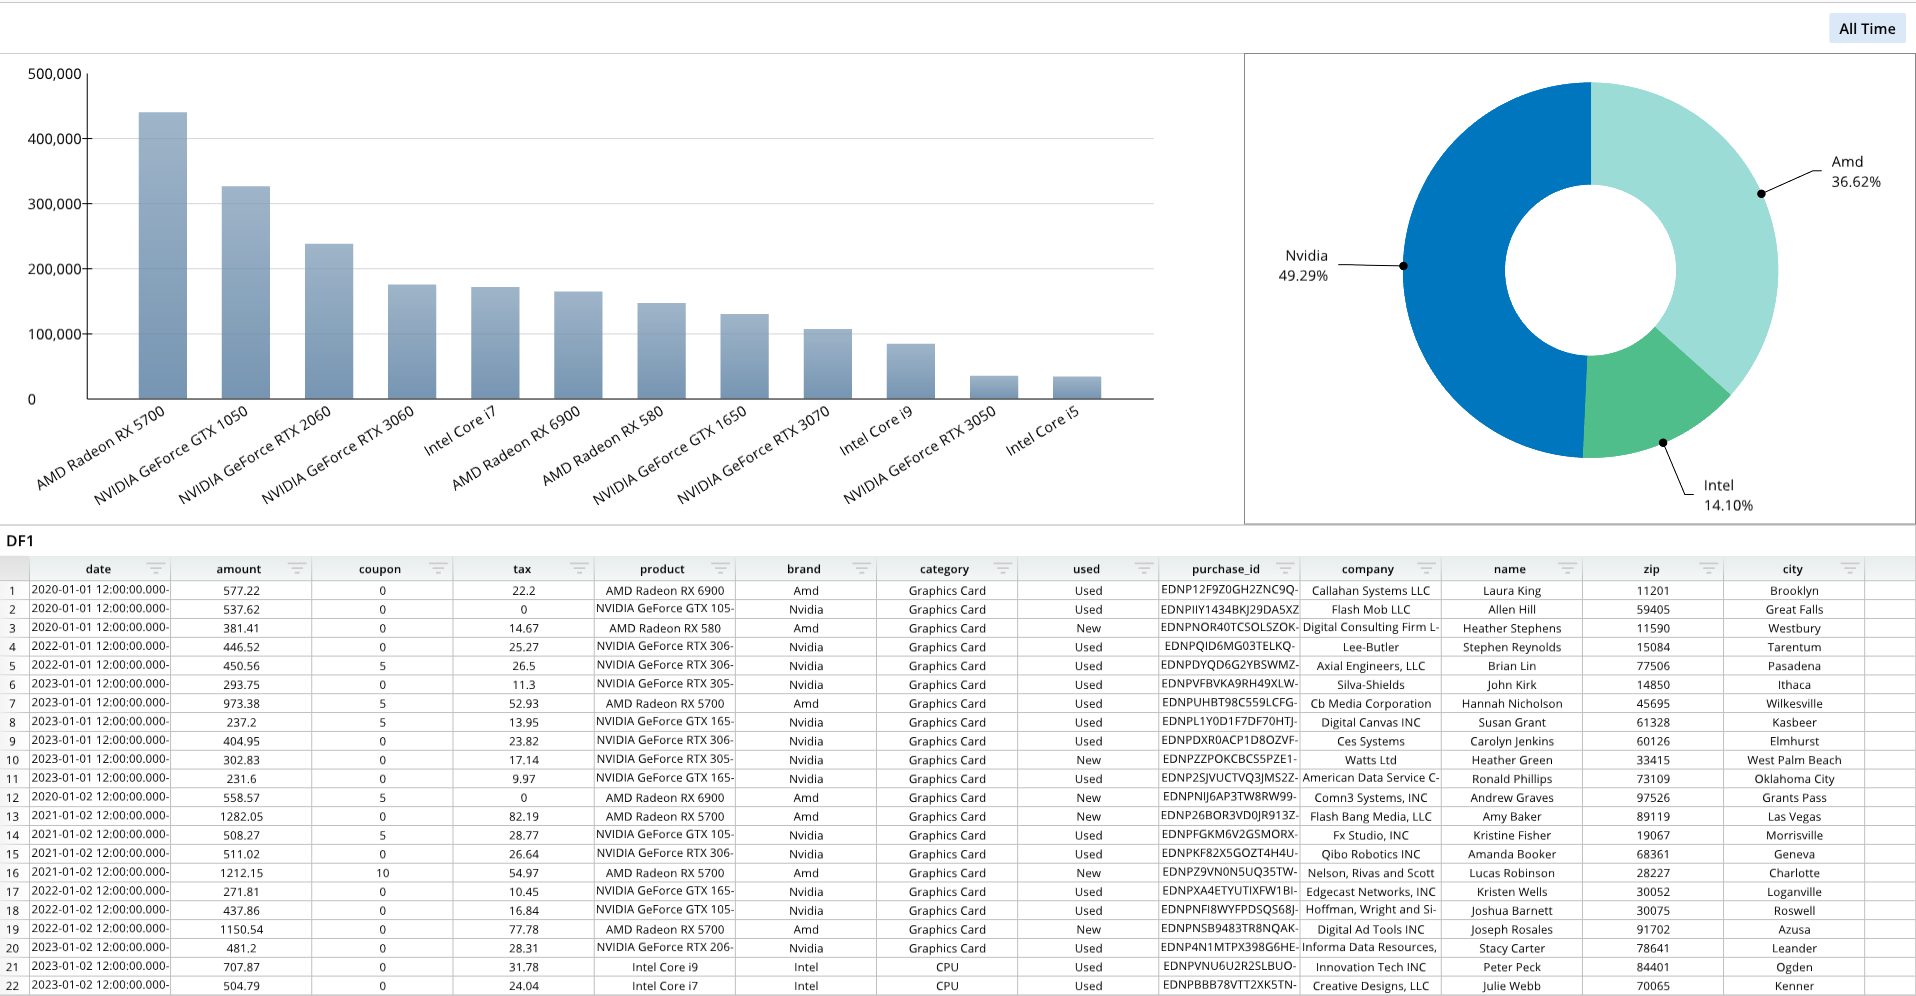
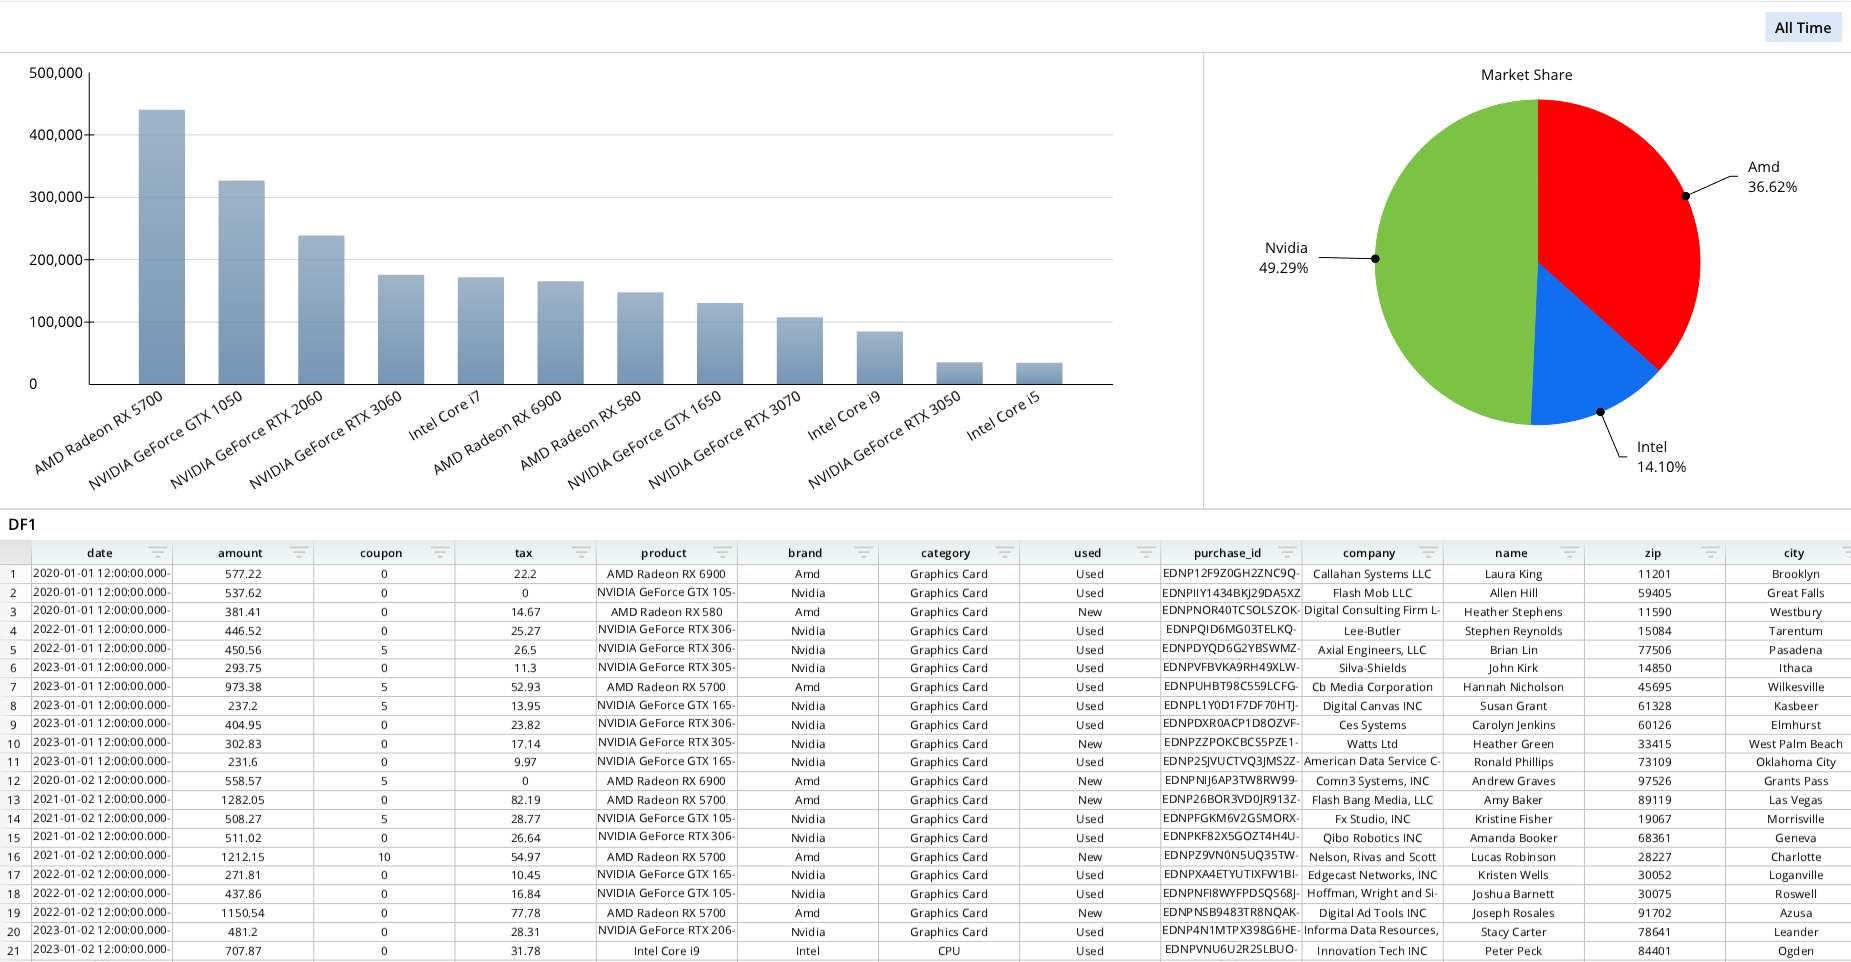
The following example builds a dashboard with both a pie chart and a bar chart.
# Module import
from row64tools.dash64 import dash64

# Dashboard save location
dash = dash64("/var/www/dashboards/temp/piebar.dash")

# Establish dashboard panes
pList = [
    ["Dashboard",       "",         "1000", "800",  "y"],
    ["TopPane",         "Dashboard",        "*",        "50%",  "x"],
    ["BottomPane",  "Dashboard",        "*",        "*",    ""],
    ["LeftPane",        "TopPane",      "*",        "*",    ""],
    ["RightPane",       "TopPane",      "35%",      "*",    ""]
]
dash.Layout.set_panes(pList)

# Add a dataframe
dash.add_ramdb("/var/www/ramdb/live/RAMDB.Row64/Examples/HardwareSales.ramdb","DF1")
dash.add_df("DF1", "BottomPane")

# Add and format a data node, to be used for the bar chart
dnDef = [[ "CROSSLINK", ["DF1",1,4], ["df","col","col"] ],
         [ "GROUPSUM",  [1],         ["col"]            ]]
dash.add_datanode("DNode1", "DF1", dnDef)

# Bar chart definition list, using the first data node
bDef = [[ "amount", "=DNode1!A:A", "=DNode1!B:B" ] ] # Name, Labels, Values

# Bar chart formatting options list
bOptions = [
    ["Format","AxisX","LabelRotation",-.35],
    ["Format","BarOrder",2],
    ["Details","Legend","Show",True],
    ["Details","Legend","Pos",[.88,.04]],
    ["Series",0,"Alphas",[0.8, 0.8, 0.8, 0.8]]
]

# Add the bar chart
dash.add_bar("Bar1", "LeftPane", bDef, bOptions)

# Format and add a second data node, to be used for the pie chart
dnDef2 = [[ "CROSSLINK", ["DF1",1,5], ["df","col","col"] ],
         [ "GROUPSUM",  [1],         ["col"]            ]]
dash.add_datanode("DNode2", "DF1", dnDef2)

# Pie chart definition, using the second data node
pDef = [[ "amount", "=DNode2!A:A", "=DNode2!B:B" ] ]  # Name, Labels, Values

# Pie chart formatting list
pOptions = [
    ["Details", "ColorTheme",[0xff0000,0x0070ff,0x89d84d]],
    ["Details","ShowTitle",True],
    ["Details","Title","Market Share"]
]

# Add the pie chart to a dashboard pane
dash.add_pie("Pie1", "RightPane", pDef, pOptions)

# Save the dashboard
dash.save()
Pie Chart Format Options
The following tables list the available formatting options for pie charts. To format pie charts, include formatting items in the pOptions list. Each formatting item should be encapsulated in brackets [ ], and formatting items should be separated by commas. For an example of a pOptions list with multiple formatting items, please see the Code Example above.
General Formatting
| Parameter Keys | Value Type | Example | Description |
|---|---|---|---|
| "Format","Color" | int - hex color | ["Format","Color",0x000000] | Background Color of the Pane |
| "Format","CrossLinking" | bool | ["Format","CrossLinking",False] | False = Disable Cross filtering for this Pane |
| "Format","Pad" | float | ["Format","Pad",.15] | Percentage of Total Height/Width Padding on Pane |
| "Format","Doughnut" | float | ["Format","Doughnut",0.46] | Display as Doughnut or Pie Shape: between 0 - 1 |
| "Format","FitScale" | float | ["Format","FitScale",0.9] | Scale Factor Of Pie Chart to fit in Pane, between 0 - 1 |
| "Format","PrimarySep" | int | ["Format","PrimarySep",3] | Primary Seperator Between Label Parts: 0 = none, 1 = comma, 2 = semicolon, 3 = period, 4 = newline, 5 = space |
| "Format","SecondarySep" | int | ["Format","SecondarySep",3] | Secondary Seperator Between Label Parts: 0 = none, 1 = comma, 2 = semicolon, 3 = period, 4 = newline, 5 = space |
| "Format","LabelTypes" | [int,int,int] | ["Format","LabelTypes",[2,0,0]] | Content of Point Label [primary, secondary1, secondary2] where 0 = none, 1 = label, 2 = value |
| "Format","Reverse" | bool | ["Format","Reverse",True] | Reverses primary & secondary order of Labels |
| "Format","FontAlignment" | [float,float] | ["Format","FontAlignment",[0.5,0.6]] | Alignment of Label Text [x alignment, y alignment] between 0 - 1 |
| "Format","LabelShift" | float | ["Format","LabelShift",.3] | Position of Value Labels as a percentage relative to top of bar |
| "Format","ShowLine" | bool | ["Format","ShowLine",True] | Show Line From Bar Chart To Labels |
| "Format","LeaderLine","Color" | int - hex color | ["Format","LeaderLine","Color",0xFF000] | Line color on Line From Bar Chart To Labels |
| "Format","LeaderLine","Size" | float | ["Format","LeaderLine","Size",2.1] | Line size / thickness on Line From Bar Chart To Labels |
| "Format","LeaderLine","Alpha" | float | ["Format","LeaderLine","Alpha",.5] | Line transparency on Line From Bar Chart To Labels |
| "Format","LeaderPos" | float | ["Format","LeaderPos",1.3] | Text Radial Extension from Inside To Outside. Between 0 - 2, 0 = inside, 2 = far outside |
| "Format","LeaderDotSize" | float | ["Format","LeaderDotSize",6.0] | Dot Size at Start of Leader Line, in Pixels |
| "Format","LineEnd" | float | ["Format","LineEnd",.45] | Length of Horizontal Line Extending From Radial Leader Line. betweem 0 - 1 |
| "Format","SpacingByAngle" | float | ["Format","SpacingByAngle",.45] | Warps the spacing betwen Leader Lines by Angle to reduce crowding & text overlap |
| "Format","SpacingByLength" | float | ["Format","SpacingByLength",.45] | Warps the spacing betwen Leader Lines by Length to reduce crowding & text overlap |
| "Format","SpacingArea" | float | ["Format","SpacingArea",.45] | How close the Leader Lines need to be until Spacing to reduce Crowding is Applied. Between 0 - 1 |
| "Format","PrimaryFont","Size" | float | ["Format","PrimaryFont","Size",25] | Font size of Primary Label |
| "Format","PrimaryFont","Color" | int - hex color | ["Format","PrimaryFont","Color",0xFF000] | Font Color of Primary Label |
| "Format","PrimaryFont","Bold" | bool | ["Format","PrimaryFont","Bold",True] | Font Bold of Primary Label |
| "Format","PrimaryFont","Italic" | bool | ["Format","PrimaryFont","Italic",True] | Font Italic of Primary Label |
| "Format","PrimaryFont","Underline" | bool | ["Format","PrimaryFont","Underline",True] | Font Underline of Primary Label |
| "Format","PrimaryFont","Alpha" | float | ["Format","PrimaryFont","Alpha",.5] | Font Transparency of Primary Label |
| "Format","SecondaryFont","Size" | float | ["Format","SecondaryFont","Size",25] | Font size of Secondary Label |
| "Format","SecondaryFont","Color" | int - hex color | ["Format","SecondaryFont","Color",0xFF000] | Font Color of Secondary Label |
| "Format","SecondaryFont","Bold" | bool | ["Format","SecondaryFont","Bold",True] | Font Bold of Secondary Label |
| "Format","SecondaryFont","Italic" | bool | ["Format","SecondaryFont","Italic",True] | Font Italic of Secondary Label |
| "Format","SecondaryFont","Underline" | bool | ["Format","SecondaryFont","Underline",True] | Font Underline of Secondary Label |
| "Format","SecondaryFont","Alpha" | float | ["Format","SecondaryFont","Alpha",.5] | Font Transparency of Secondary Label |
Series Data
(Index must be 0; pie charts use a single series).
| Parameter Keys | Value Type | Example | Description |
|---|---|---|---|
| "Series",0,"Name" | string | ["Series",0,"Name","Enter Series Name"] | Name of the series |
| "Series",0,"Labels" | string | ["Series",0,"Labels","=DF1!B:B"] | Lables on the series (list or cell reference like Excel). Ex: '={"Label_01","Label_02","Label_03"}' |
| "Series",0,"Values" | string | ["Series",0,"XValues","=DF1!A:A"] | Cell reference of the Values in the series (list or cell reference like Excel). Ex: '={1,3,2.95}' |
Details
| Parameter Keys | Value Type | Example | Description |
|---|---|---|---|
| "Details","ColorTheme" | [float,float,float,float] | ["Details", "ColorTheme",[0xaf4425,0x662e1c,0xc9a66b,0xebdcb2]] | Color Theme For Pie Chart |
| "Details","ShowTitle" | bool | ["Details","ShowTitle",True] | Show Chart Title |
| "Details","Title" | string | ["Details","Title","Enter Chart Title"] | String of Chart Title |
| "Details","GroupType" | int | ["Details","GroupType",1] | 0 = Series Not Grouped, 1 = Series are Grouped |
| "Details","TitleFont","Size" | float | ["Details","TitleFont","Size",25] | Font size of Title (if ShowTitle is True) |
| "Details","TitleFont","Color" | int - hex color | ["Details","TitleFont","Color",0xFF000] | Font Color of Title (if ShowTitle is True) |
| "Details","TitleFont","Bold" | bool | ["Details","TitleFont","Bold",True] | Font Bold of Title (if ShowTitle is True) |
| "Details","TitleFont","Italic" | bool | ["Details","TitleFont","Italic",True] | Font Italic of Title (if ShowTitle is True) |
| "Details","TitleFont","Underline" | bool | ["Details","TitleFont","Underline",True] | Font Underline of Title (if ShowTitle is True) |
| "Details","TitleFont","Alpha" | float | ["Details","TitleFont","Alpha",.5] | Font Transparency of Title (if ShowTitle is True) |
| "Details","TitlePos" | [float,float] | ["Details","TitlePos",[.5,.05]] | Chart Title x,y as a percentage of Pane Height/Width |
| "Details","Gaps" | [float] | ["Details","Gaps",[2.2]] | Spread between Pie Slides is Gap[0] |
| "Details","Legend","Show" | bool | ["Details","Legend","Show",True] | Show Chart Legend |
| "Details","Legend","Pos" | [float,float] | ["Details","Legend","Pos", [0.755, 0.15]] | Chart Legend x,y as a percentage of dimensions |
| "Details","Legend","Dim" | [float,float] | ["Details","Legend","Dim", [100.0, 100.0]] | Chart Legend w,y dimensions in pixels |
| "Details","Legend","HasBorder" | bool | ["Details","Legend","HasBorder",True] | Chart Legend Border is Visible |
| "Details","Legend","Border","Color" | int - hex color | ["Details","Legend","Border","Color",0xFF000] | Line color of Legend Border |
| "Details","Legend","Border","Size" | float | ["Details","Legend","Border","Size",2.1] | Line size / thickness of Legend Border |
| "Details","Legend","Border","Alpha" | float | ["Details","Legend","Border","Alpha",.5] | Line transparency of Legend Border |
| "Details","Legend","HasFill" | bool | ["Details","Legend","HasFill", True] | Chart Legend is Filled |
| "Details","Legend","Fill","Color" | int - hex color | ["Details","Legend","Fill","Color",0xFF000] | Fill Color of Legend |
| "Details","Legend","Fill","Alpha" | float | ["Details","Legend","Fill","Alpha",.5] | Transparency of Legend Fill |
| "Details","Legend","Font","Size" | float | ["Details","Legend","Font","Size",25] | Font size of Legend |
| "Details","Legend","Font","Color" | int - hex color | ["Details","Legend","Font","Color",0xFF000] | Font Color of Legend |
| "Details","Legend","Font","Bold" | bool | ["Details","Legend","Font","Bold",True] | Font Bold of Legend |
| "Details","Legend","Font","Italic" | bool | ["Details","Legend","Font","Italic",True] | Font Italic of Legend |
| "Details","Legend","Font","Underline" | bool | ["Details","Legend","Font","Underline",True] | Font Underline of Legend |
| "Details","Legend","Font","Alpha" | float | ["Details","Legend","Font","Alpha",.5] | Font Transparency of Legend |
| "Details","Legend","ChipSize" | float | ["Details","Legend","ChipSize",7.0] | Legend Chip Size |
| "Details","Legend","ChipSpacing" | float | ["Details","Legend","ChipSpacing",5.0] | Legend Spacing Between Chips |
| "Details","Layout","RPadding" | float | ["Details","Layout","RPadding",10.0] | Chart Right Padding Inset In Addition To Pane Padding |
| "Details","Layout","LPadding" | float | ["Details","Layout","LPadding",10.0] | Chart Left Padding Inset In Addition To Pane Padding |
| "Details","Layout","TPadding" | float | ["Details","Layout","TPadding",10.0] | Chart Top Padding Inset In Addition To Pane Padding |
| "Details","Layout","BPadding" | float | ["Details","Layout","BPadding",10.0] | Chart Bottom Padding Inset In Addition To Pane Padding |
| "Details","Layout","HasChartBorder" | bool | ["Details","Layout","HasChartBorder",True] | Chart Border Around Chart Area (Does Not Include Label Area) |
| "Details","Layout","ChartBorder","Color" | int - hex color | ["Details","Layout","ChartBorder","Color",0xFF000] | Line color of Chart Border |
| "Details","Layout","ChartBorder","Size" | float | ["Details","Layout","ChartBorder","Size",2.1] | Line size / thickness of Chart Border |
| "Details","Layout","ChartBorder","Alpha" | float | ["Details","Layout","ChartBorder","Alpha",.5] | Line transparency of Chart Border |
| "Details","Layout","HasChartFill" | bool | ["Details","Layout","HasChartFill",True] | Fill Inner Chart Area (Does Not Include Label Area) |
| "Details","Layout","ChartFill","Color" | int - hex color | ["Details","Layout","ChartFill","Color",0xFF000] | Fill Color Of Inner Chart Area |
| "Details","Layout","ChartFill","Alpha" | float | ["Details","Layout","ChartFill","Alpha",.5] | Transparency Of Inner Chart Area Fill |
| "Details","Layout","HasBkgdFill" | bool | ["Details","Layout","HasBkgdFill",True] | Fill Chart Area (Drawn Overtop Of Any Pane Color) |
| "Details","Layout","BkgdFill","Color" | int - hex color | ["Details","Layout","BkgdFill","Color",0xFF000] | Fill Color Of Chart Area (Drawn Overtop Of Any Pane Color) |
| "Details","Layout","BkgdFill","Alpha" | float | ["Details","Layout","BkgdFill","Alpha",.5] | Transparency Of Chart Area Fill (Drawn Overtop Of Any Pane Color) |