Logging
Pane Logging
Users have the ability to log the current pane list on a dashboard. This log feature is useful for understanding the pane layout of a dashboard before or after making changes. Logging outputs the pane structure to the terminal. To log panes, simply include the dash.Layout.log_panes() in the dashboard creation or modification Python code.
The following example displays a configuration block that includes the log function:
from dash64 import dash64
dash = dash64("/var/www/dashboards/temp/layout_demo.dash")
pList = [
    ["Main",                "",                 "1000",         "800",      "y"],
    ["Header",              "Main",             "*",            "15%",      "" ],
    ["BottomPane",          "Main",             "*",            "*",        "x"],
    ["Footer",              "Main",             "*",            "10%",      "" ],
    ["Bar",                 "BottomPane",       "20%",          "*",        "" ],
    ["MainPane",            "BottomPane",       "*",            "*",        "" ],
    ["RightBar",            "BottomPane",       "20%",          "*",        "" ]
]
dash.Layout.set_panes(pList)
dash.Layout.log_panes()
This example includes the dash.Layout.log_panes() function at the bottom of the code. Users can alternatively use this line at the top of their Python configuation code blocks to output their dashboard's pane layout before making changes.
The dash.Layout.log_panes() function outputs the opened dashboard's pane layout to the terminal. This example outputs the following log:
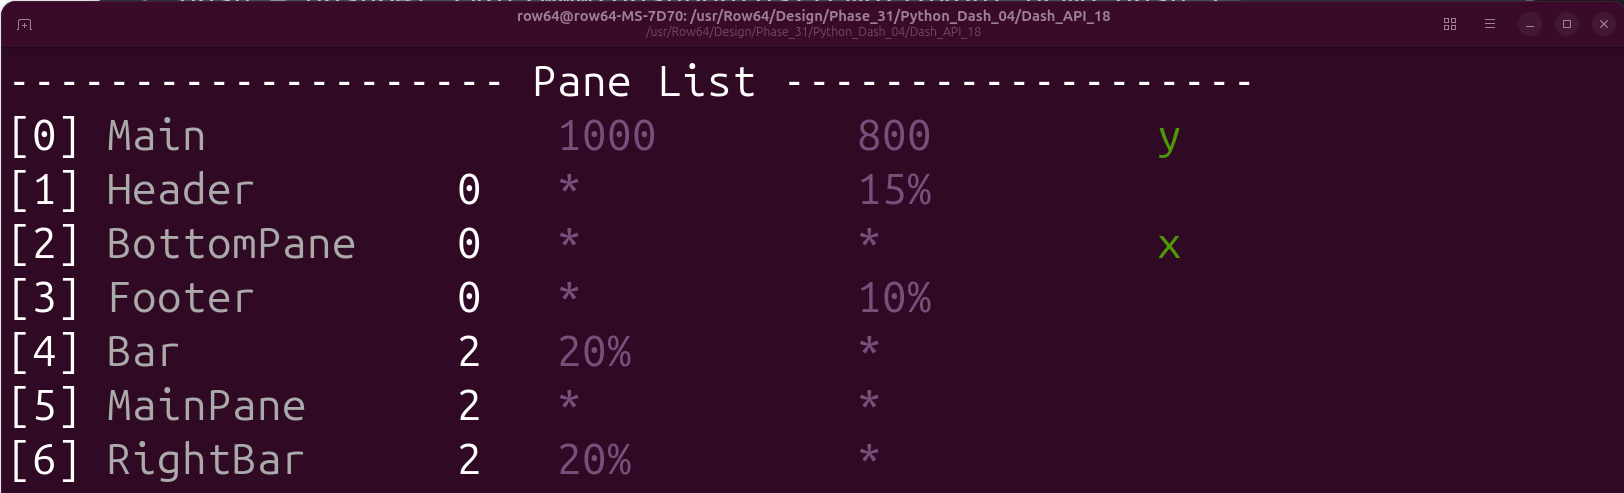
The terminal output closely resembles the pList layout in the Python code, but with some minor differences. The following diagram identifies each column in the log terminal output:
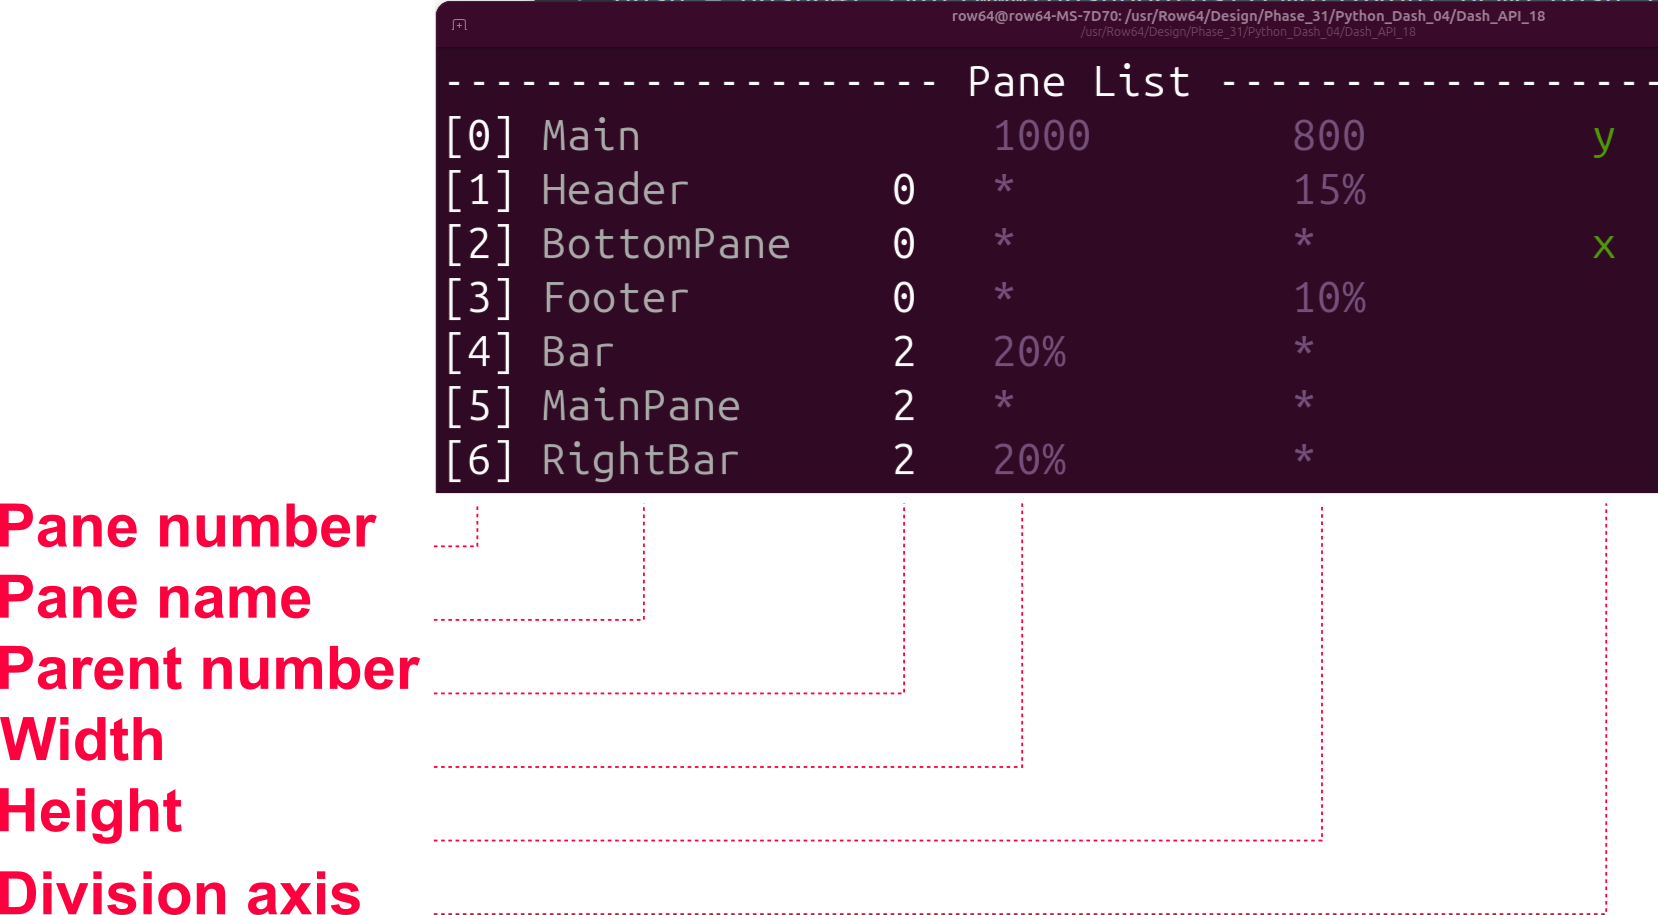
Pane log columns:
- Pane number: A numeric identifier for a pane.
- The pane number is used to identify a pane's parent in the parent column rather than the pane's name.
- Pane name: The name of a pane.
- A pane's name is established in the pane list (pList) block of the Python dashboard configuration.
- Parent number: The numeric identity of the pane's parent.
- This column simply identifies the pane's parent. The parent numbers map to the pane numbers in the first column.
- In this example, Bar's parent is pane 2, which is BottomPane. Footer's parent is pane 0, which is Main.
- Width: The width of a pane.
- Values can include a static number for pixels (e.g.
30), a percentage (e.g.30%), or an asterisk (*) for fill. For more information, please see the Defining Pane Resizing Behavior section of the Dashboard Layout page.
- Values can include a static number for pixels (e.g.
- Height: The height of a pane.
- Values can include a static number for pixels (e.g.
30), a percentage (e.g.30%), or an asterisk (*) for fill. For more information, please see the Defining Pane Resizing Behavior section of the Dashboard Layout page.
- Values can include a static number for pixels (e.g.
- Division axis: The axis upon which to split children panes.
- Values can include
xfor the x-axis, oryfor the y-axis. To learn more about dividing children panes, please see the Pane List page.
- Values can include
Global Graph Logging
It is possible to log the Global Graph to the terminal by including the dash.Graph.log() line in a dashboard configuration file.
For example, the following code generates a new dashboard:
from row64tools.dash64 import dash64
dash = dash64("/var/www/dashboards/temp/bar.dash")
pList = [
    ["Dashboard",       "",             "1600",     "900",  "y"],
    ["TopPane",         "Dashboard",    "*",        "*",    ""],
    ["BottomPane",      "Dashboard",    "*",        "50%",  ""]
]
dash.Layout.set_panes(pList)
dash.add_ramdb("/var/www/ramdb/live/RAMDB.Row64/Examples/HardwareSales.ramdb","DF1")
dash.add_df("DF1", "BottomPane")
dnDef = [[ "CROSSLINK", ["DF1",1,4], ["df","col","col"] ],
         [ "GROUPSUM",  [1],         ["col"]            ]]
dash.add_datanode("DNode1", "DF1", dnDef)
dash.save()
dash.Graph.log()
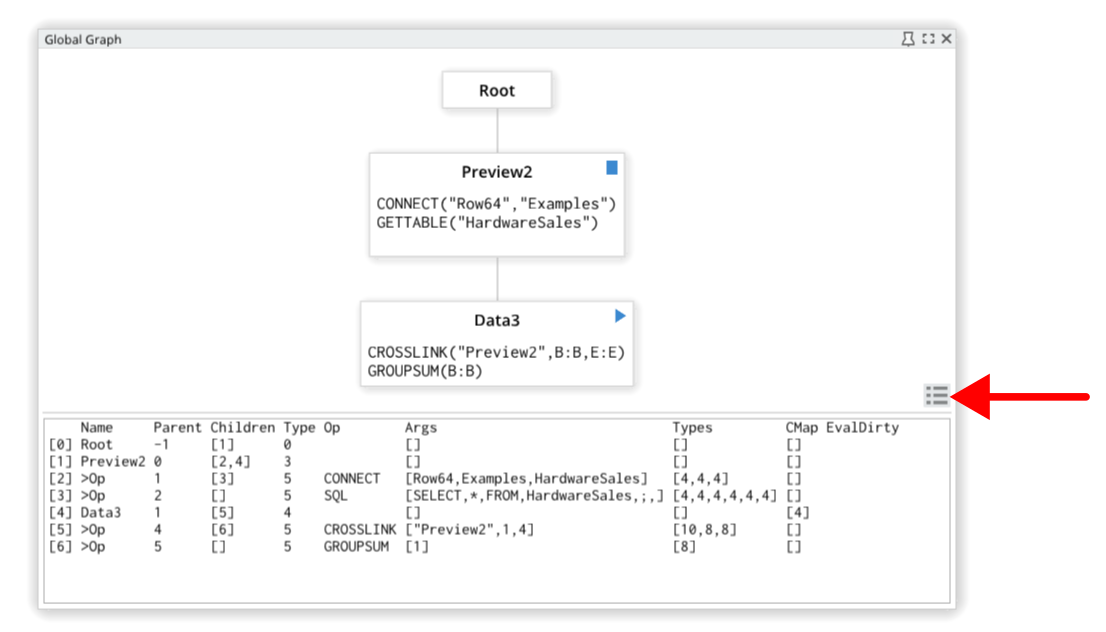
This configuration creates a new dashboard, but also includes the dash.Graph.log() function at the bottom of the file, which outputs the Global Graph to the terminal.
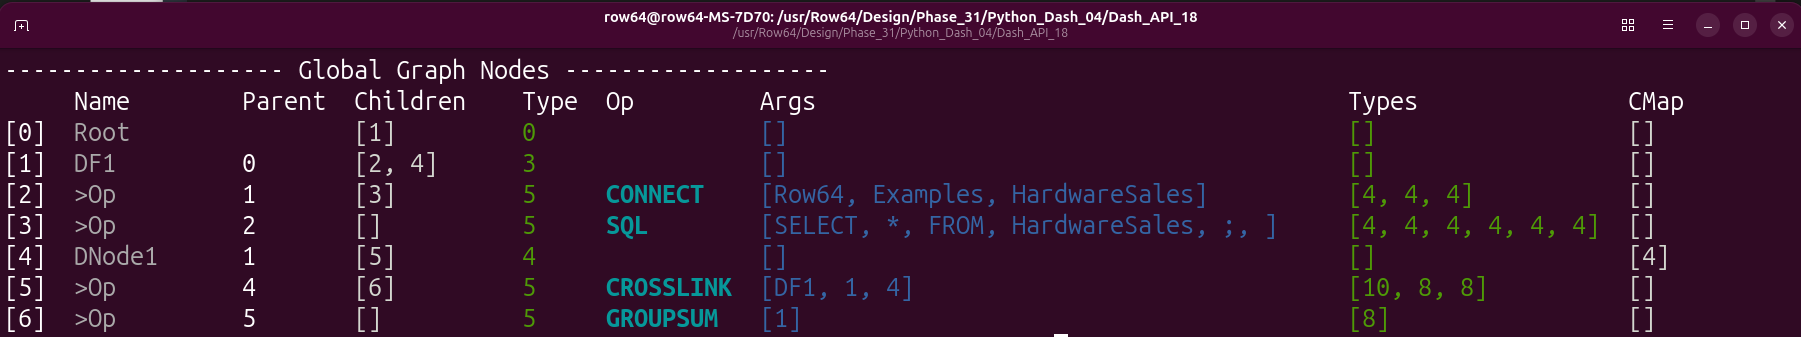
The dash.Graph.log() function logs the same Global Graph to the terminal as one you would see in Row64 Studio:
Spreadsheet Logging
Spreadsheets can also be logged to the terminal. When a dashboard contains a spreadsheet, the dash.DAG.log("SHEET_NAME") function can be used to output the spreadsheet details to the terminal.
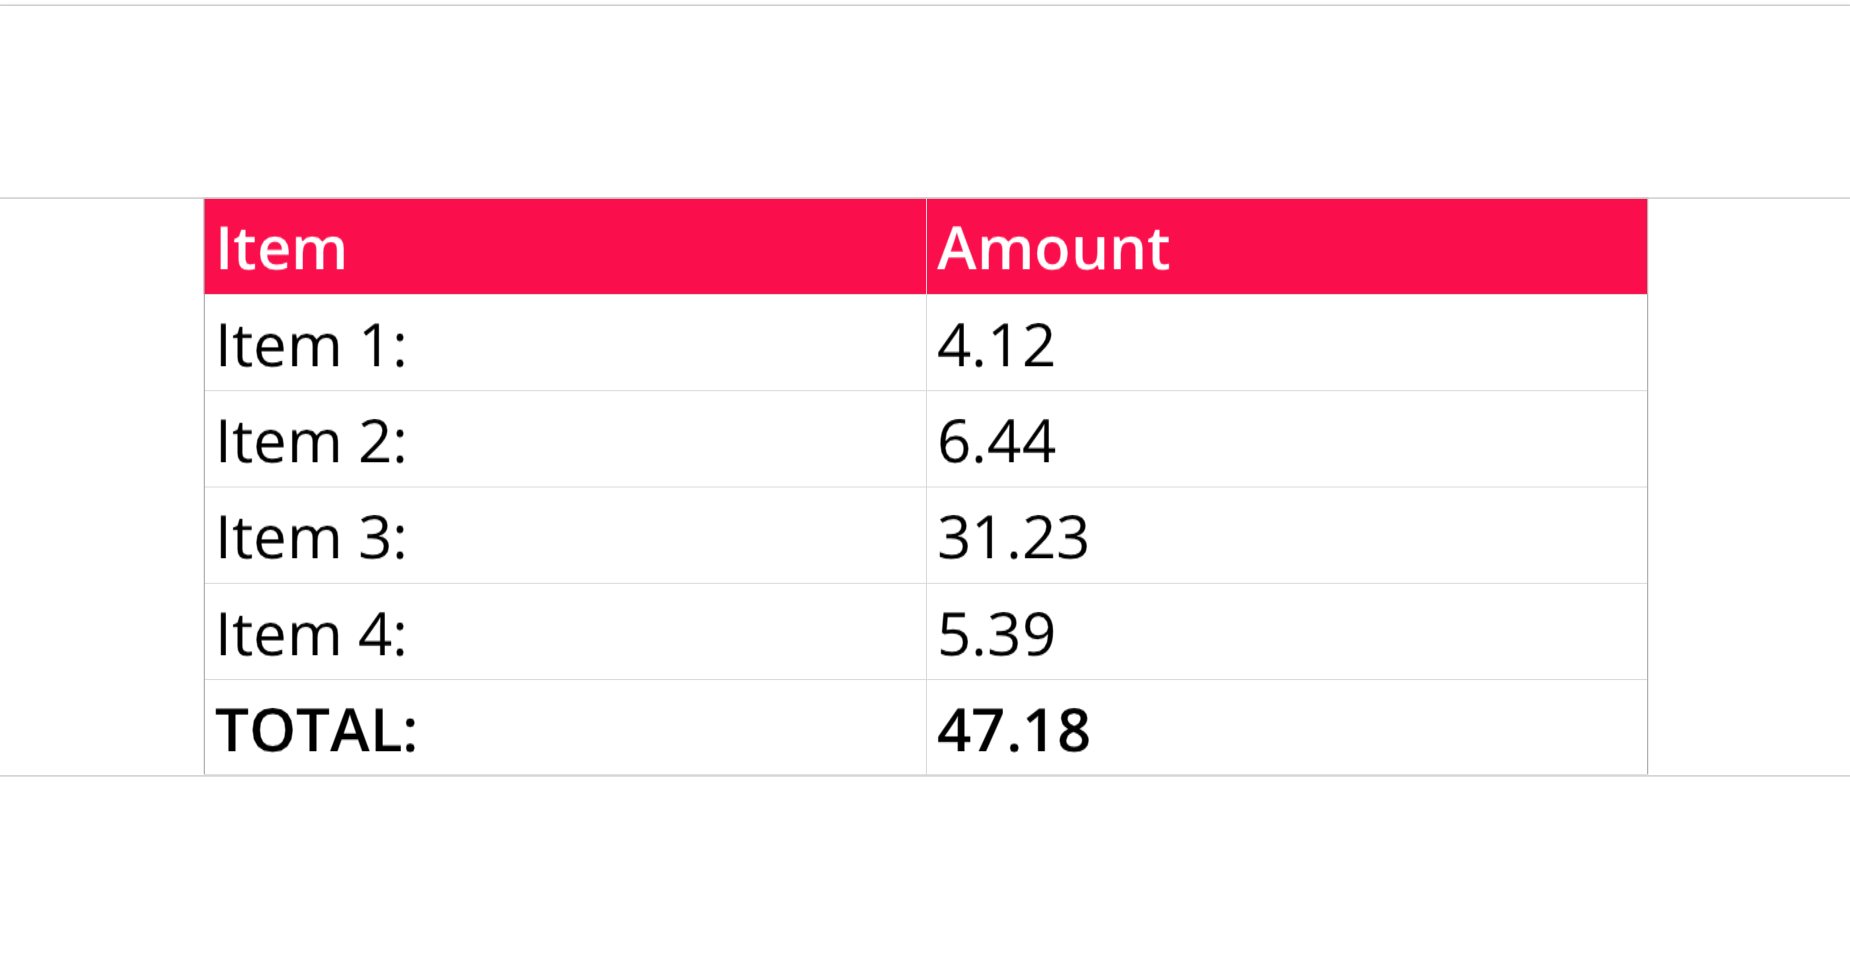
For example, the following code generates a simple dashboard that contains a small spreadsheet:
from row64tools.dash64 import dash64
dash = dash64("/var/www/dashboards/temp/ssheet.dash")
pList = [
    ["Main",            "",             "1600",     "900",  "y"],
    ["TopPane",         "Main",         "*",        "20%",  ""],
    ["MidPane",         "Main",         "*",        "*",    ""],
    ["BottomPane",      "Main",         "*",        "20%",  ""]
]
dash.Layout.set_panes(pList)
ssDef = [
["A1","Item","BCfa0f4cOFFFFFF"],["B1","Amount","BCfa0f4cOFFFFFF"],
    ["A2","Item 1:"],["B2",    "4.12"],
        ["A3","Item 2:"],["B3",    "6.44"],
        ["A4","Item 3:"],["B4",    "31.23"],
        ["A5","Item 4:"],["B5",    "5.39"],
        ["A6","TOTAL:","B"],["B6", "=SUM(B2:B5)","B","#,###.00"],
]
dim = [0, 0, 1, 5]
dash.add_spreadsheet("Sheet1", dim, ssDef, "MidPane")
dash.DAG.log("Sheet1")
dash.save()
As the dash.DAG.log("Sheet1") function is included at the bottom of the configuration code, a spreadsheet log is also outputted to the terminal when the configuration executes:
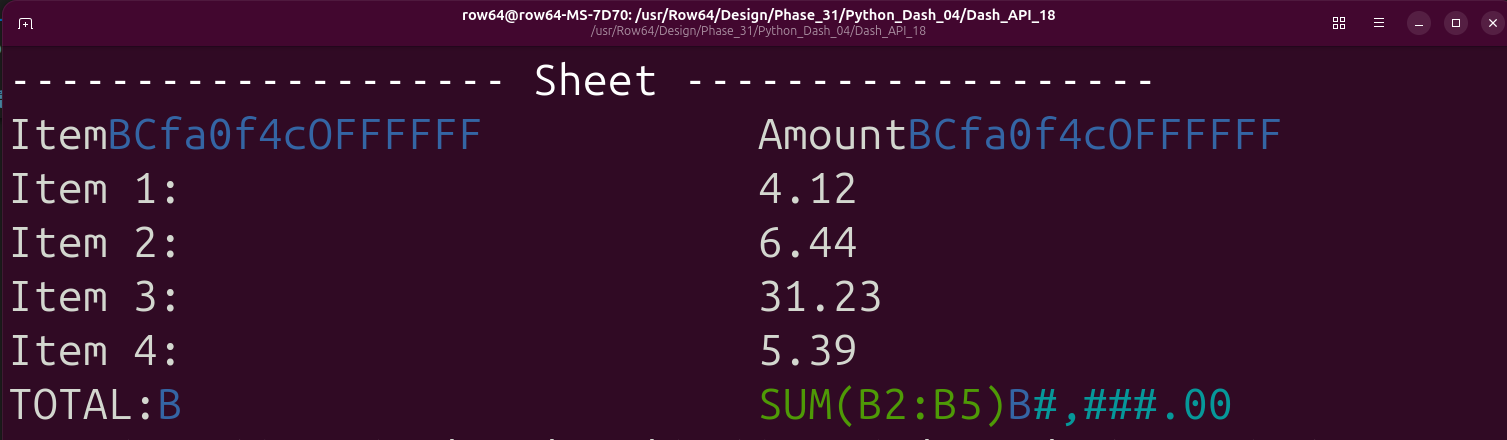
In the terminal log, cell content is color-coded. Values are white, formulas are green, format codes are blue, and number format formulas are cyan.