Pane List
The pList block establishes the panes on the dashboard ("pList" stands for "pane list"). This list defines all the panes on the dashboard, the panes' parents, if applicable, and formatting properties, such as width, height, and an axis upon which to divide child panes (x or y).
Each column in a pList block addresses a specific property of a pane:
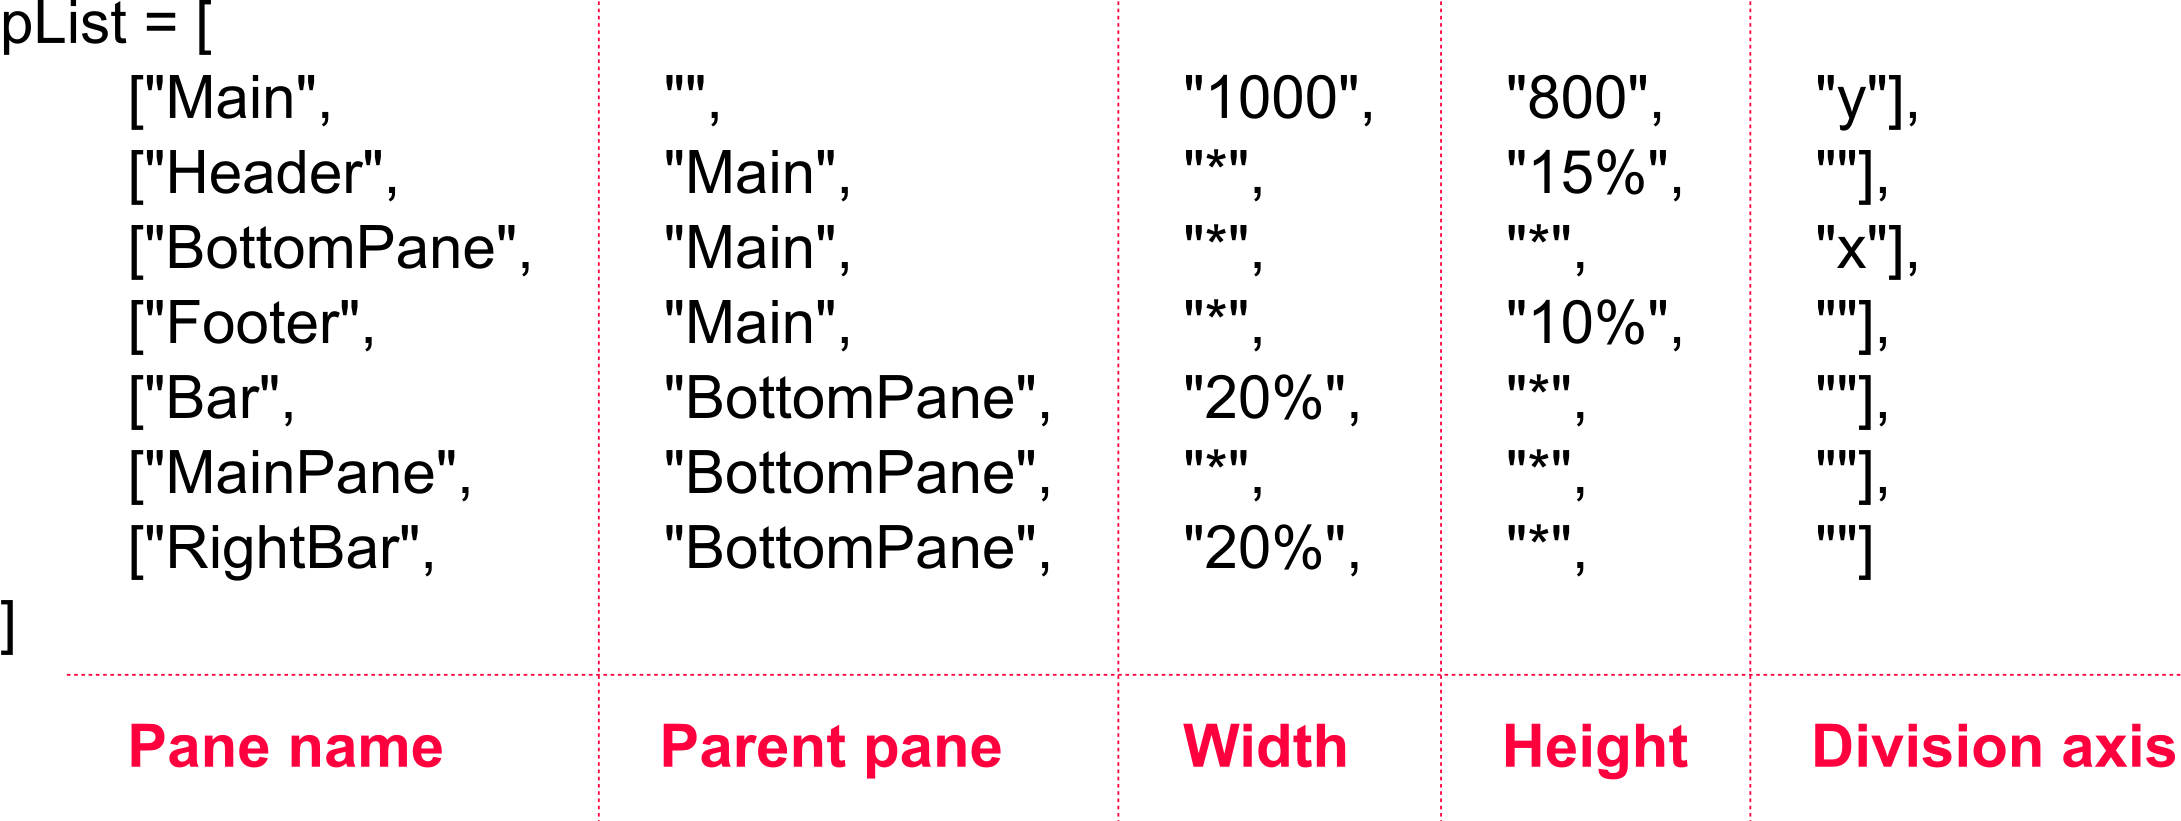
pList Columns:
- Pane name: The name of a pane.
- Parent pane: The name of the pane's parent.
- Dividing panes works in a tree-like fashion, with parent panes being divided into child panes, and children panes having their own children.
- For example, in the above pList image, the Header, BottomPane, and Footer panes are all children of the Main pane.
- Width: The width of a pane.
- The width can be set in pixels (e.g.
1000), as a percentage (e.g.15%), or as fill (*). - A pixel value is static and will remain unchanged if the dashboard is resized. A percentage value scales according to the defined percentage with the overall dashboard. For fill, the pane will fill the available space of its parent pane.
- The width can be set in pixels (e.g.
- Height: The height of a pane.
- The height can be set in pixels (e.g.
1000), as a percentage (e.g.15%), or as fill (*). - A pixel value is static and will remain unchanged if the dashboard is resized. A percentage value scales according to the defined percentage with the overall dashboard. For fill, the pane will fill the available space of its parent pane.
- The height can be set in pixels (e.g.
- Division axis: The axis on which to divide child panes.
- Values can be either
xfor the x-axis, oryfor the y-axis.
- Values can be either
The Fill Option
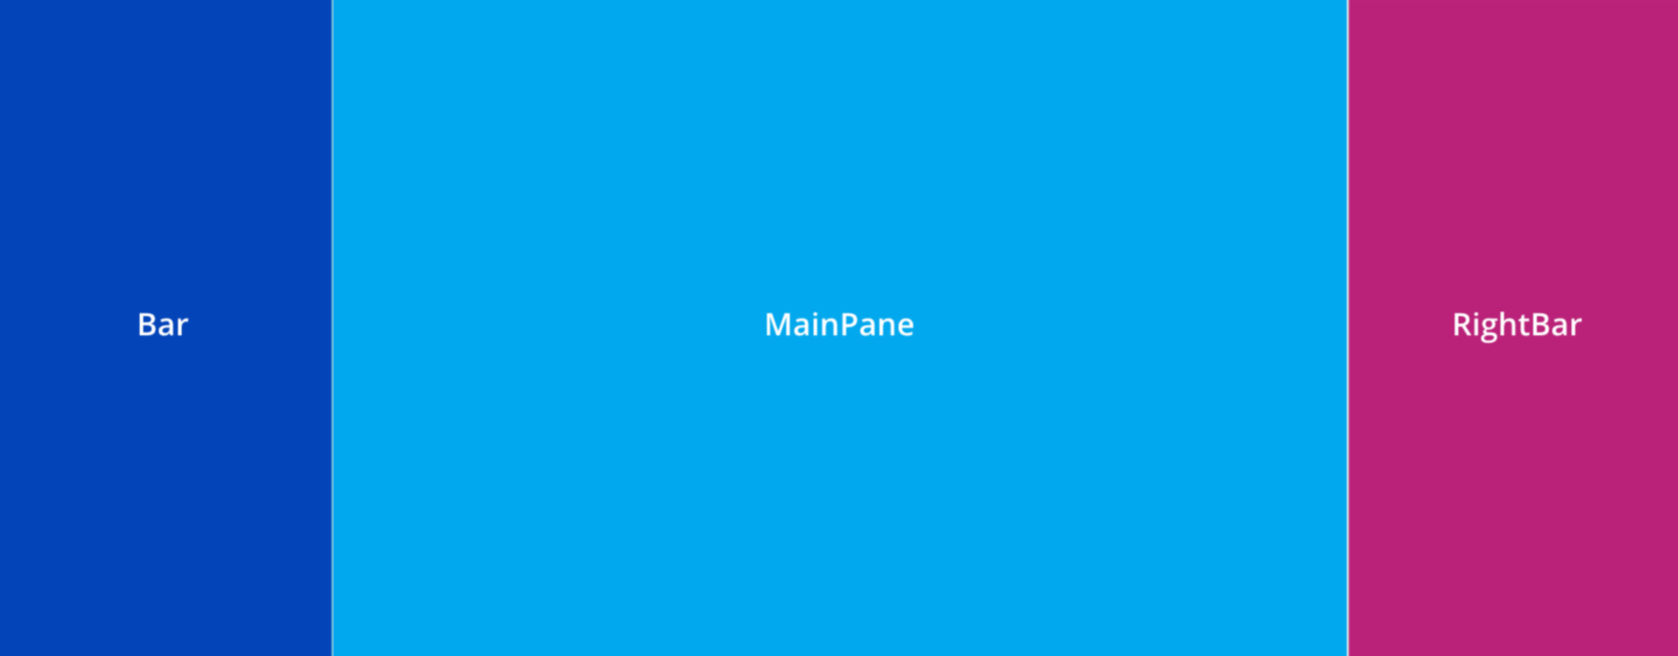
The fill option for height and width, represented by an asterisk (*), has the pane fill the available space on the construction pane or parent pane. If consecutive panes are set to fill in the same parent pane, they will divide the space evenly.
For example, if a parent pane has three children that are divided along the x-axis (so that the panes resemble columns), and all three of these children have their widths set to fill, then each of these three children will only occupy one-third of the available horizontal space.
Dividing on the x- and y-axes
On a Cartesian coordinate system, the x-axis runs horizontally, and the y-axis vertically. If you "divide on x" by specifying x in the division axis column of a pList block, you're effectively running a perpendicular line through that axis.
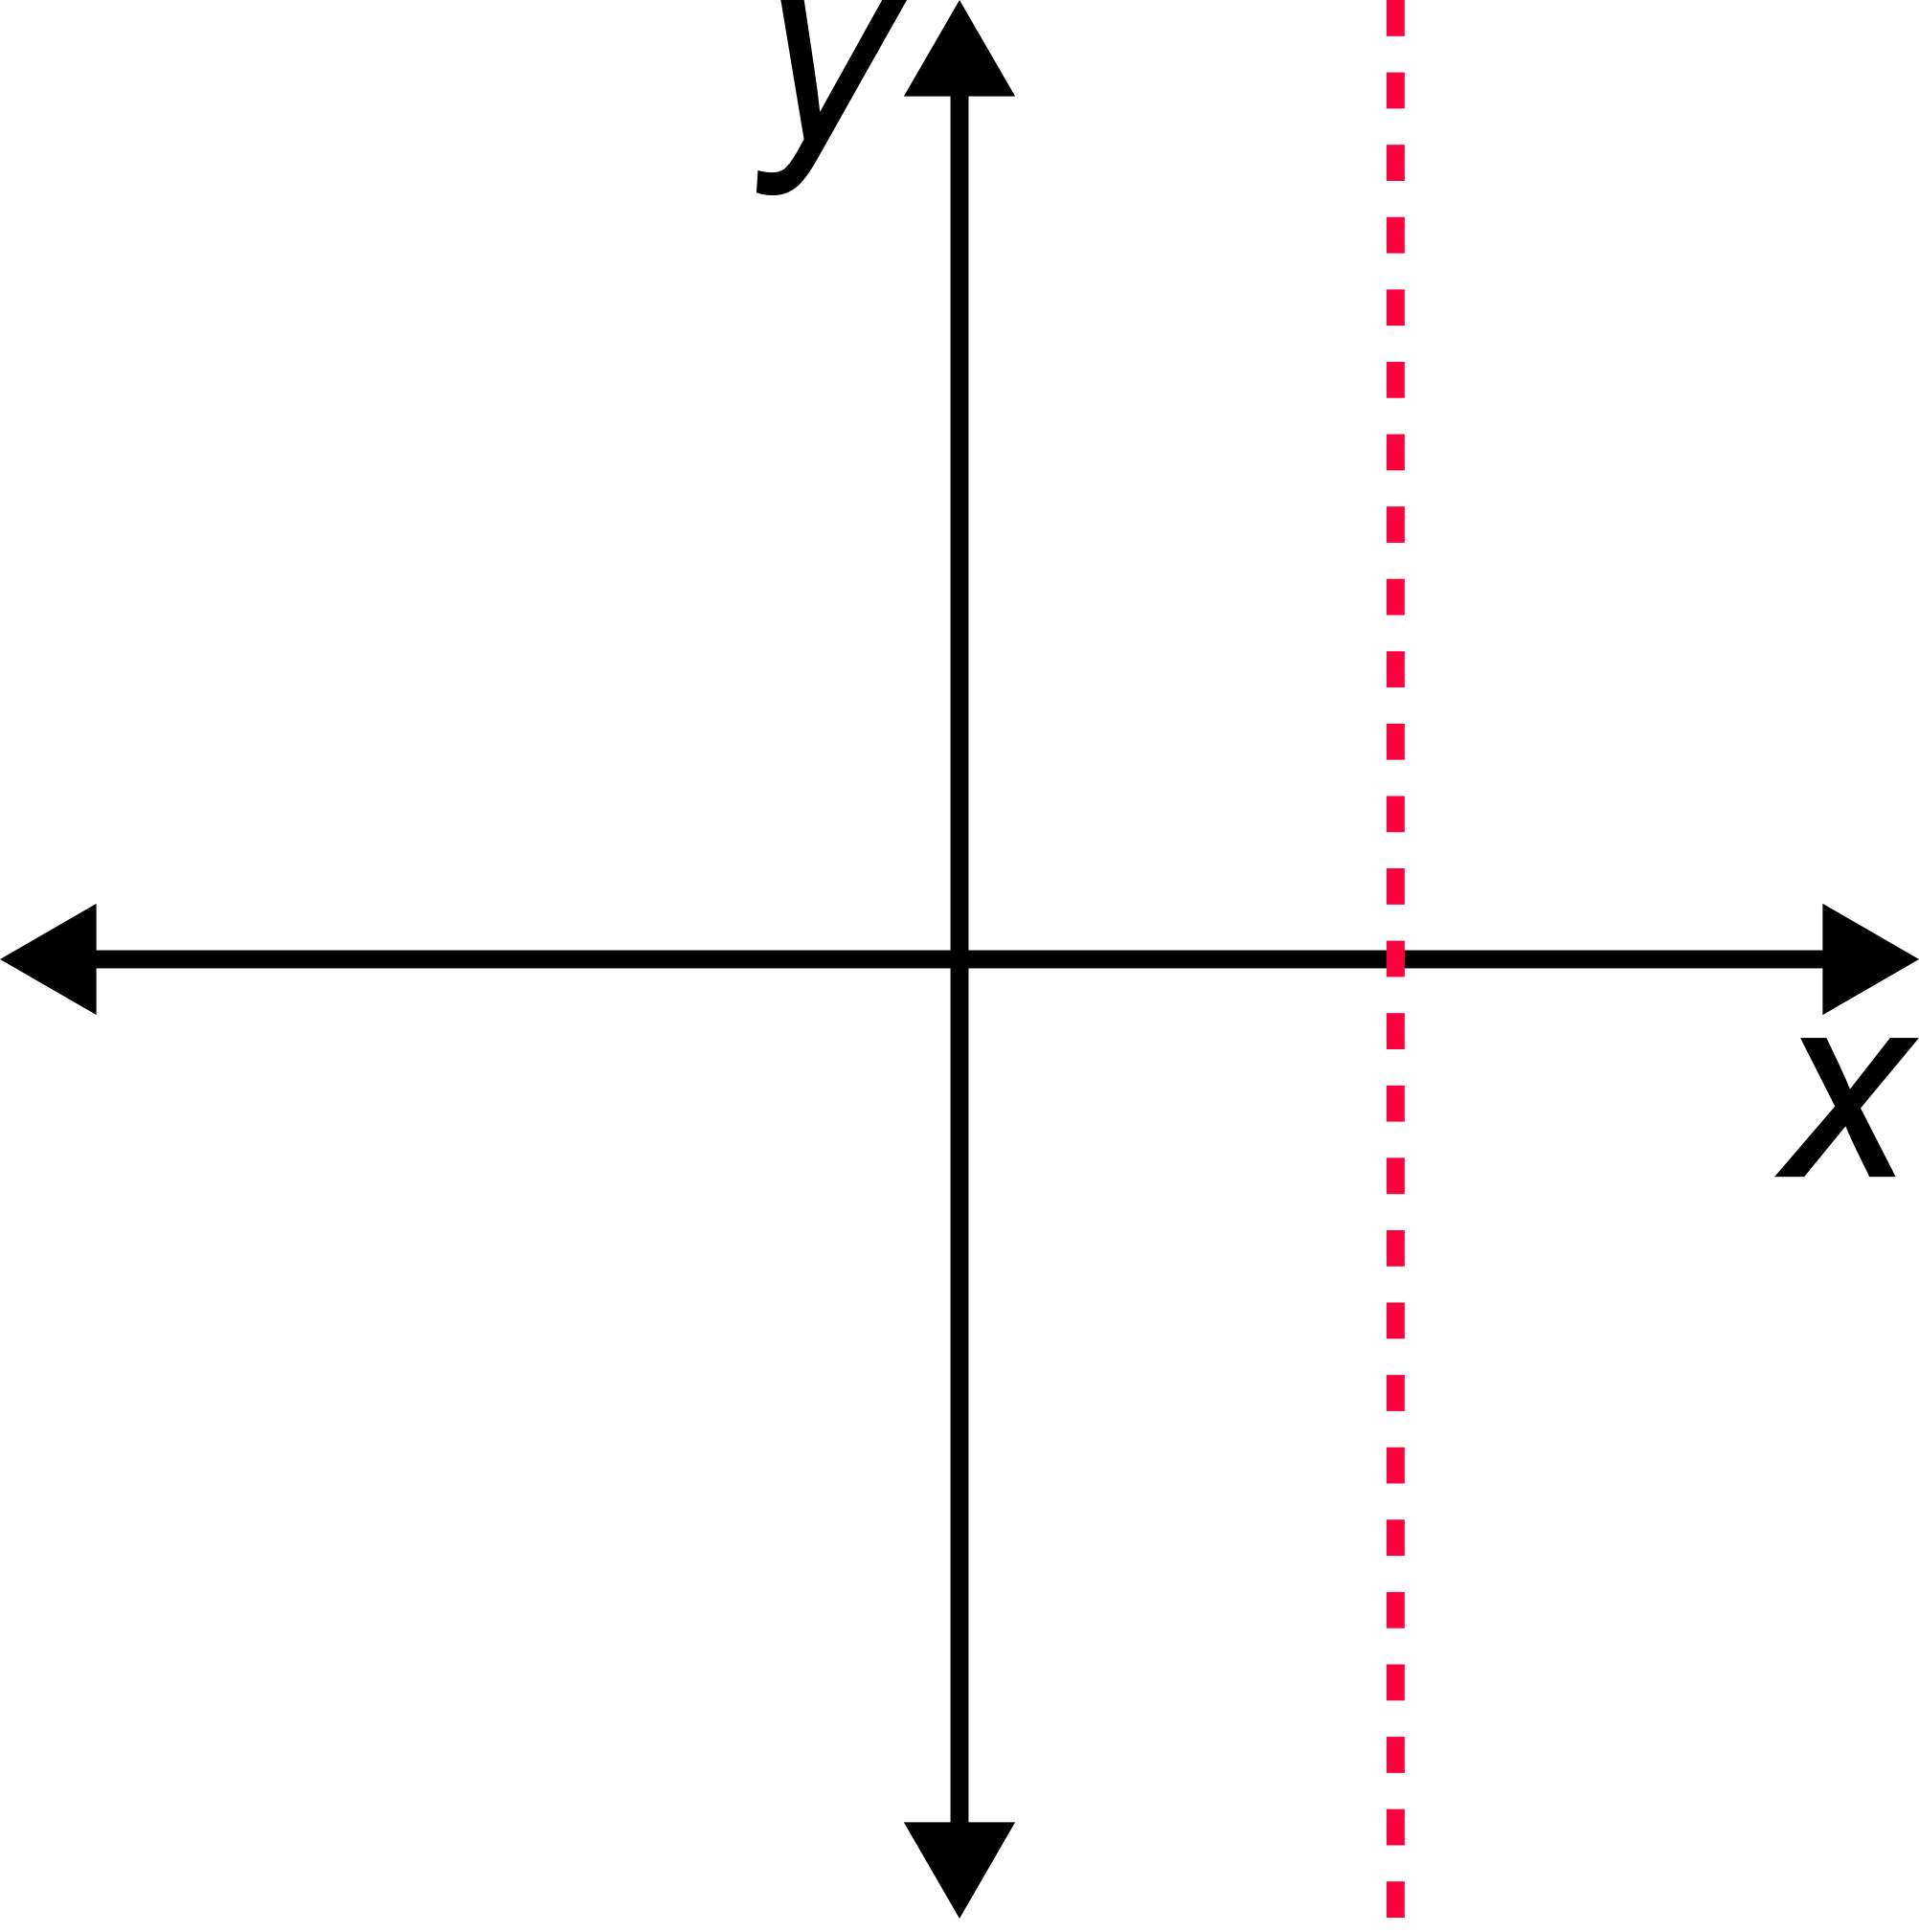
The same is true for the y-axis. If you divide on the y-axis, picture running a perpendicular line through the vertical y-axis. If you have a parent pane with multiple children panes that are divided on y, the children panes will run horizontally like rows.
For example, if you wanted a parent pane to have children pane that resembled columns, you'd divide on x.
The following Python block creates a basic dashboard from scratch and establishes a pane layout (pList = [ ... ]) with pane coloring (dash.set_pane_def(...)):
from row64tools.dash64 import dash64
dash = dash64("/var/www/dashboards/temp/layout.dash")
pList = [
    ["Main",                "",                 "1000",         "800",      "y"],
    ["Header",              "Main",             "*",            "15%",      "" ],
    ["BottomPane",          "Main",             "*",            "*",        "x"],
    ["Footer",              "Main",             "*",            "10%",      "" ],
    ["Bar",                 "BottomPane",       "20%",          "*",        "" ],
    ["MainPane",            "BottomPane",       "*",            "*",        "" ],
    ["RightBar",            "BottomPane",       "20%",          "*",        "" ]
]
dash.Layout.set_panes(pList)
dash.set_pane_def("Header", [["Color",0xa2e9dc],["Text","Header","BH2V2S35"]])
dash.set_pane_def("Bar", [["Color",0x0344b9],["Text","Bar","BH2V2S35OFFFFFF"]])
dash.set_pane_def("MainPane", [["Color",0x02a8ee],["Text","MainPane","BH2V2S35OFFFFFF"]])
dash.set_pane_def("Footer", [["Color",0x008480],["Text","Footer","BH2V2S35OFFFFFF"]])
dash.set_pane_def("RightBar", [["Color",0xba2279],["Text","RightBar","BH2V2S35OFFFFFF"]])
dash.save()
The code creates the following dashboard:
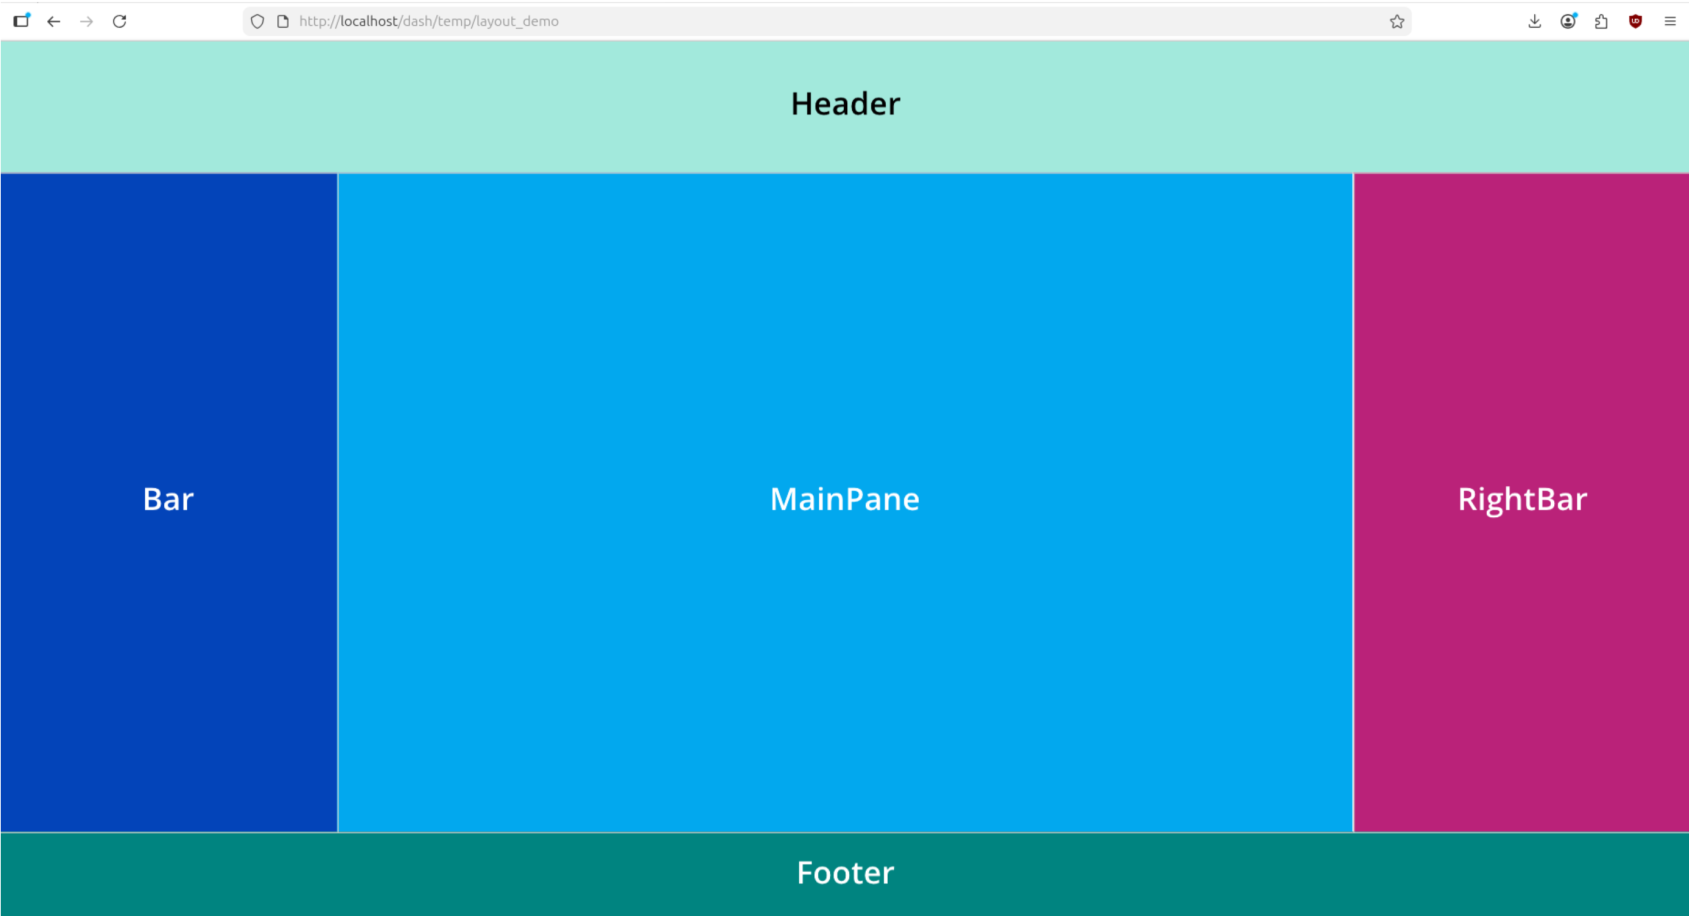
In this example, pList constructs the following panes:
- Main
- Name: Main
- Parent: The Main pane has no parents and is the first pane, serving as the foundation.
- Width: Main has a static width of 1000 pixels.
- Height: Main has a static height of 800 pixels.
- Division axis: Main has children panes that will be divided on the y-axis, so the children panes will run horizontally like rows. As seen later in the pane list, Main's children are Header, BottomPane, and Footer.
- Header
- Name: Header
- Parent: The Header pane is a child of the Main pane.
- Width: Header's width is set to fill, so it will span the full available horizontal length of the Main pane, its parent.
- Height: Header's height is 15% of the Main pane's height.
- Division axis: The Header pane does not divide space for children.
- BottomPane
- Name: BottomPane
- Parent: BottomPane is a child of Main.
- Width: Its width is set to fill, so it will span the full horizontal length of the Header pane, its parent.
- Height: Its height is also set to fill, so it will fill the remaining available vertical space of the Main pane, its parent, between the Header pane at the top and the Footer pane at the bottom.
- Division axis: The BottomPane has children of its own, which are divided on the x-axis, so its children panes will run vertically like columns. Since BottomPane has children, it is not a visible or usable pane, but serves as a container for its children panes, which are visible and usable.
- Footer
- Name: Footer
- Parent: Footer is a child of Main. Being Main's last child in the pane list, it appears at the bottom, below BottomPane.
- Width: The Footer's width is set to fill, so it will span the full available length of Main, its parent pane.
- Height: The Footer's height is 10% of the Main pane's height.
- Division axis: The Footer pane does not divide space for children.
- Bar
- Name: Bar
- Parent: Bar is a child of BottomPane. Being BottomPane's first child in the pane list and divided along the x-axis, Bar is clipped to the left side of the underlying BottomPane.
- Width: Bar's width is 20% of BottomPane's width, its parent.
- Height: Bar's height spans the full available vertical length of BottomPane.
- Division axis: The Bar pane does not divide space for children.
- MainPane
- Name: MainPane
- Parent: MainPane is a child of BottomPane. Being the second child in the list and divided on the x-axis, MainPane appears to the right of Bar, the preceding child.
- Width: MainPane's width is set to fill, so it will span all remaining horizontal space in BottomPane, its parent. When RightBar, the final child, is introduced, MainPane's width will span the available space between Bar and RightBar.
- Height: MainPane's height is set to fill, so it will span all available vertical space of BottomPane, its parent.
- Division axis: MainPane does not divide space for children.
- RightBar
- Name: RightBar
- Parent: RightBar is a child of BottomPane. Being the last child in the list, it appears to the right of MainPane, the preceding child.
- Width: RightBar's width is 20% of BottomPane's width, its parent.
- Height: RightBar's height is set to fill, so it will span all available vertical space of BottomPane, its parent.
- Division axis: RightBar does not divide space for children.
Once you define a pane layout in pList, you can populate these panes with dashboard objects and data.
Placing Panes
The pane list (pList) is simply a list of panes the dashboard contains. pList does not automatically construct the dashboard's panes, but only lists what the panes should be and how they are formatted. To construct the dashboard's panes, as defined by the pList, you must pass the pane list to the dash.Layout.set_panes() function.
To build a dashboard based on the pane list, include the following line directly after the pList block:
dash.Layout.set_panes(pList)
No further modifications are required for this function. Returning to the previous example, the dash.Layout.set_panes(pList) function is included after the pList block and before the pane formatting functions:
from row64tools.dash64 import dash64
dash = dash64("/var/www/dashboards/temp/layout.dash")
pList = [
    ["Main",                "",                 "1000",         "800",      "y"],
    ["Header",              "Main",             "*",            "15%",      "" ],
    ["BottomPane",          "Main",             "*",            "*",        "x"],
    ["Footer",              "Main",             "*",            "10%",      "" ],
    ["Bar",                 "BottomPane",       "20%",          "*",        "" ],
    ["MainPane",            "BottomPane",       "*",            "*",        "" ],
    ["RightBar",            "BottomPane",       "20%",          "*",        "" ]
]
dash.Layout.set_panes(pList)
dash.set_pane_def("Header", [["Color",0xa2e9dc],["Text","Header","BH2V2S35"]])
dash.set_pane_def("Bar", [["Color",0x0344b9],["Text","Bar","BH2V2S35OFFFFFF"]])
dash.set_pane_def("MainPane", [["Color",0x02a8ee],["Text","MainPane","BH2V2S35OFFFFFF"]])
dash.set_pane_def("Footer", [["Color",0x008480],["Text","Footer","BH2V2S35OFFFFFF"]])
dash.set_pane_def("RightBar", [["Color",0xba2279],["Text","RightBar","BH2V2S35OFFFFFF"]])
dash.save()