DashAPI Examples
This page provides several DashAPI dashboard examples. This page is intended to be used as a quick reference when designing custom dashboards and offers many DashAPI template ideas. The DashAPI is not limited to the examples on this page; anything that is possible in Row64 Studio is possible in the DashAPI. For information and explanations on the code components required to generate dashboards, please refer to the relevant articles throughout the DashAPI documentation.
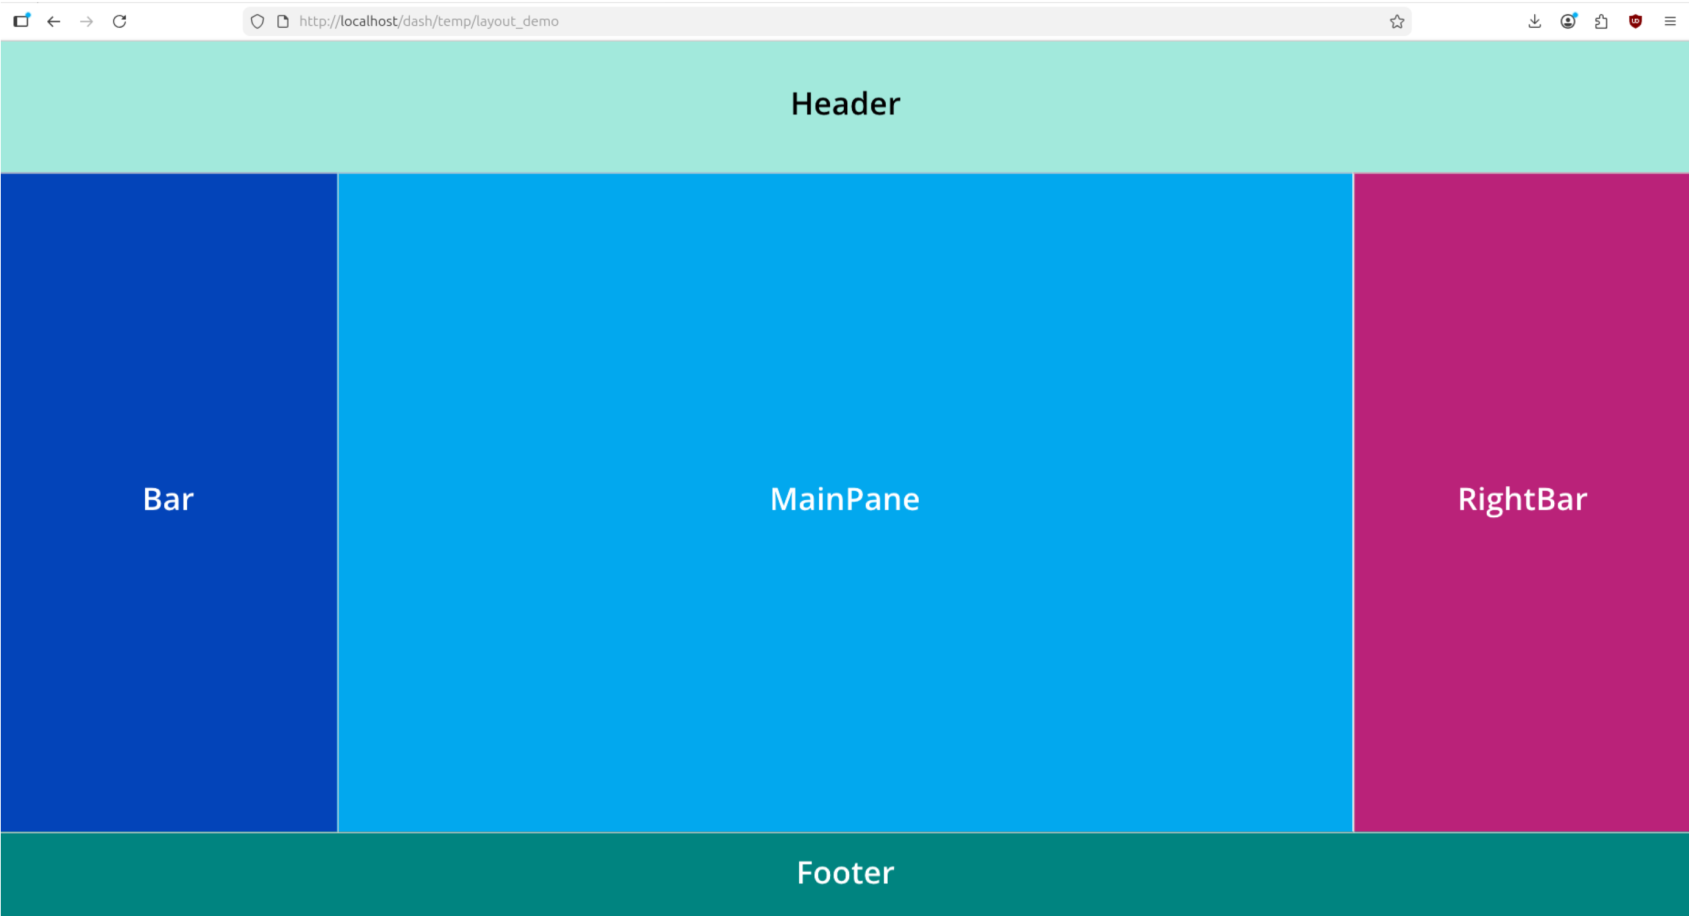
Create, Label, and Color Panes
from row64tools.dash64 import dash64
dash = dash64("/var/www/dashboards/temp/layout.dash")
pList = [
    ["Main",                "",                 "1000",         "800",      "y"],
    ["Header",              "Main",             "*",            "15%",      "" ],
    ["BottomPane",          "Main",             "*",            "*",        "x"],
    ["Footer",              "Main",             "*",            "10%",      "" ],
    ["Bar",                 "BottomPane",       "20%",          "*",        "" ],
    ["MainPane",            "BottomPane",       "*",            "*",        "" ],
    ["RightBar",            "BottomPane",       "20%",          "*",        "" ]
]
dash.Layout.set_panes(pList)
dash.set_pane_def("Header", [["Color",0xa2e9dc],["Text","Header","BH2V2S35"]])
dash.set_pane_def("Bar", [["Color",0x0344b9],["Text","Bar","BH2V2S35OFFFFFF"]])
dash.set_pane_def("MainPane", [["Color",0x02a8ee],["Text","MainPane","BH2V2S35OFFFFFF"]])
dash.set_pane_def("Footer", [["Color",0x008480],["Text","Footer","BH2V2S35OFFFFFF"]])
dash.set_pane_def("RightBar", [["Color",0xba2279],["Text","RightBar","BH2V2S35OFFFFFF"]])
dash.save()
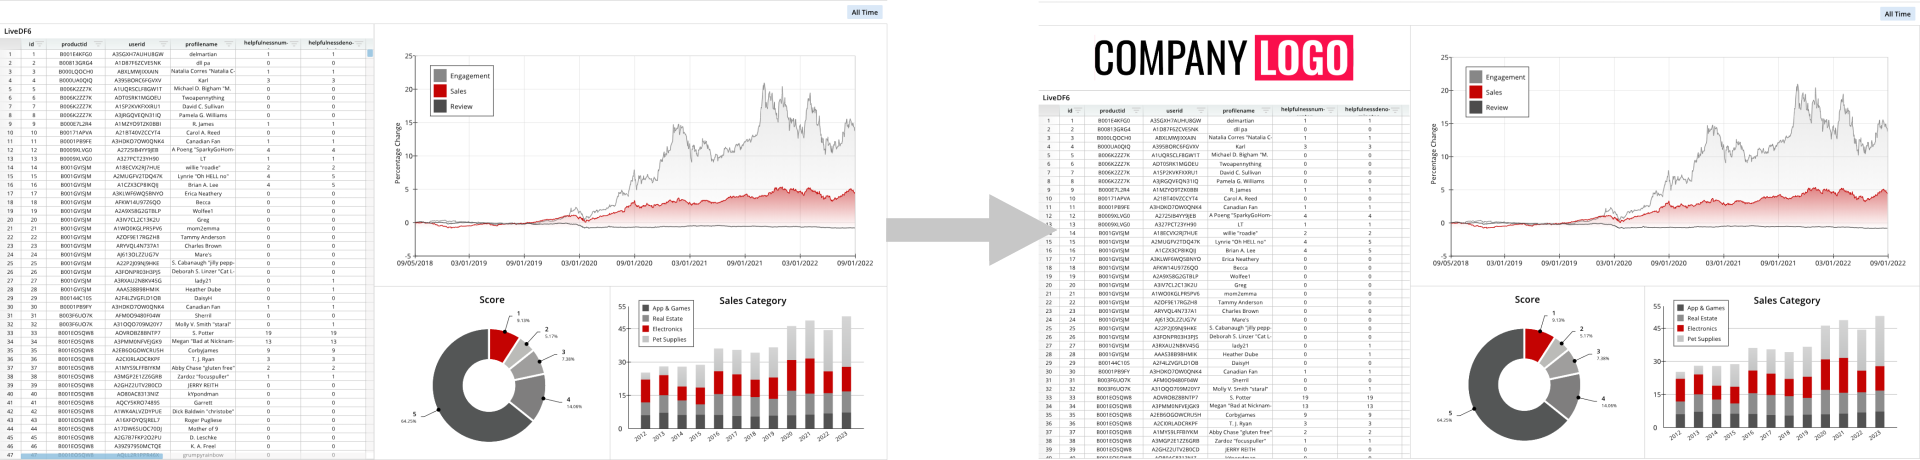
Load and Modify an Existing Dashboard
from row64tools.dash64 import dash64
import os
dash = dash64("/var/www/dashboards/temp/mod.dash")
dash.load("/var/www/dashboards/examples/amazon.dash")
dash.Layout.divide_pane(1, True, "y","15%","LogoPane")
dash.Layout.log_panes()
imgPath = os.path.join(dash.get_folder(),"Company_Logo.png")
imgDef = [["Padding", .3]]
dash.add_image("LogoPane", imgPath, imgDef)
dash.save()
Dashboard Content
Dataframes
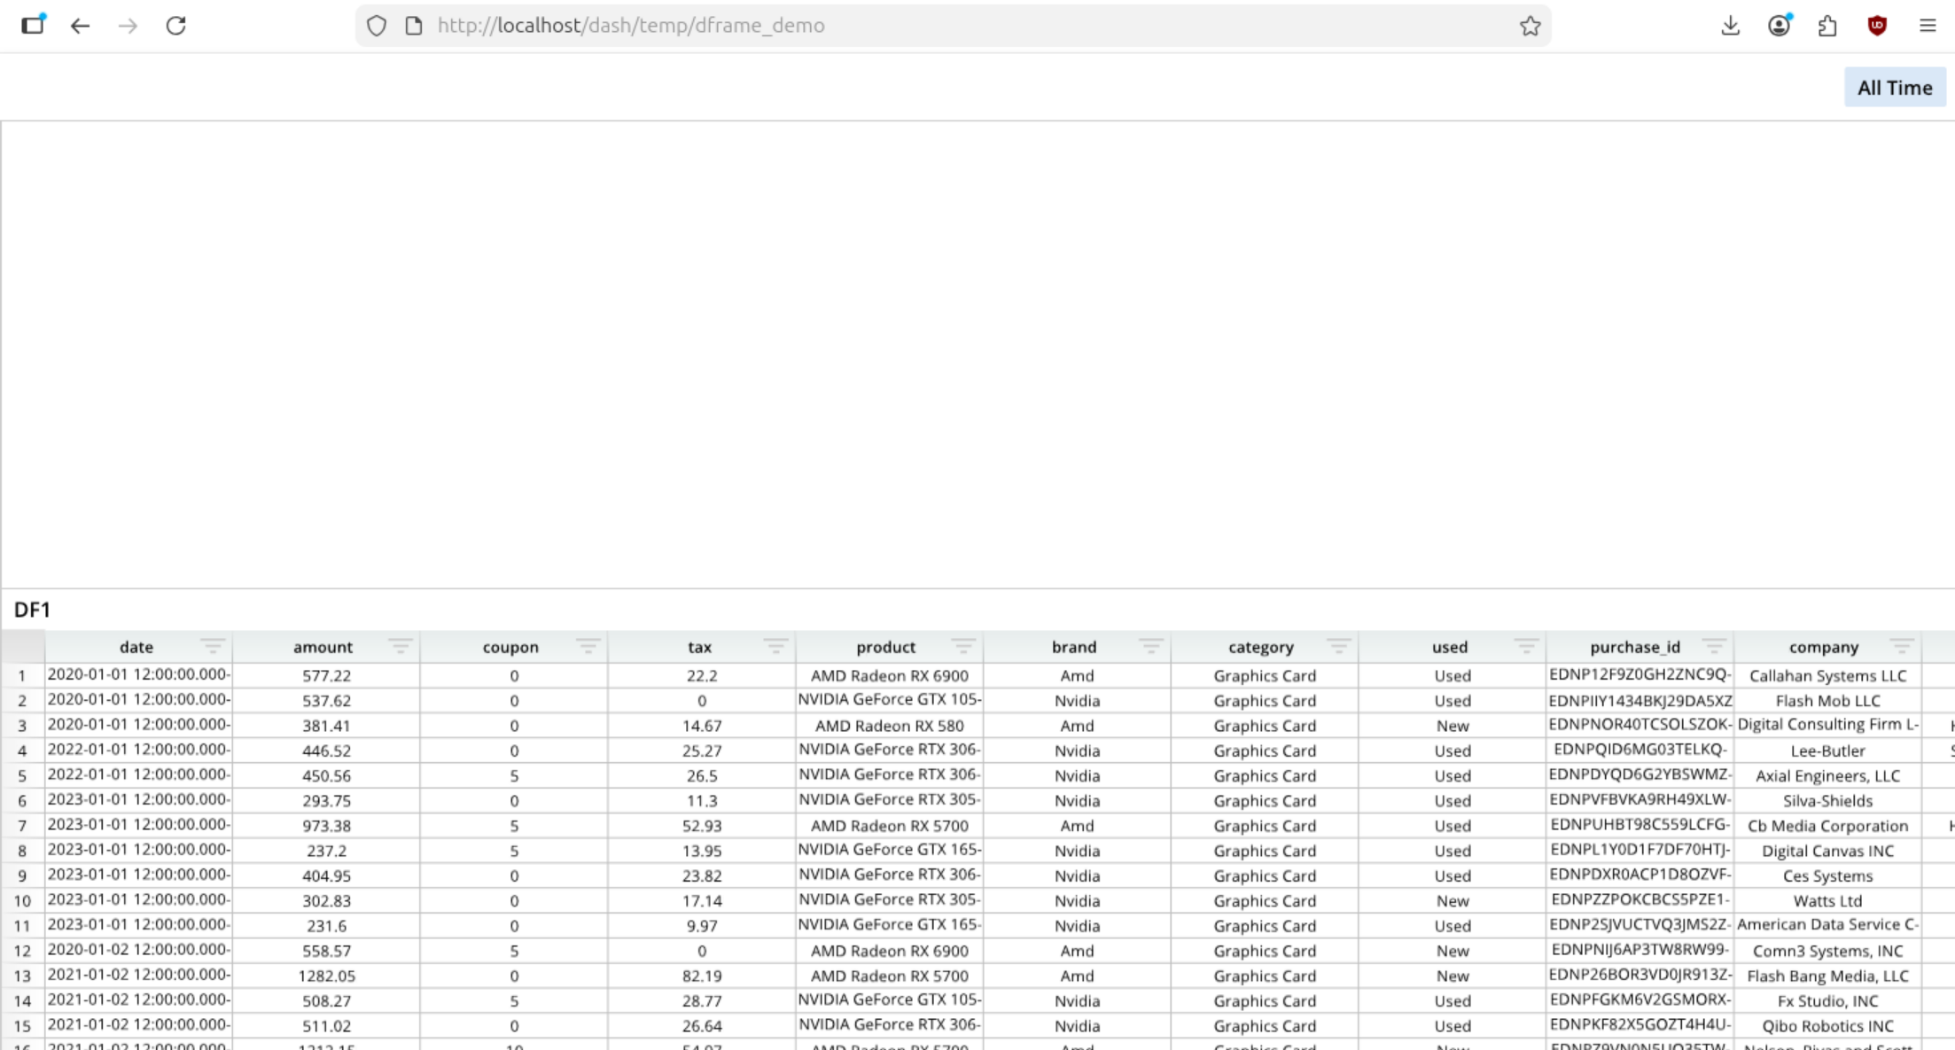
Add a Dataframe
from row64tools.dash64 import dash64
dash = dash64("/var/www/dashboards/temp/dframe_demo.dash")
pList = [
    ["Dashboard",       "",             "1600",     "900",  "y"],
    ["TopPane",         "Dashboard",    "*",        "*",    ""],
    ["BottomPane",      "Dashboard",    "*",        "50%",  ""]
]
dash.Layout.set_panes(pList)
dash.add_ramdb("/var/www/ramdb/live/RAMDB.Row64/Examples/HardwareSales.ramdb","DF1")
dash.add_df("DF1", "BottomPane")
dash.save()
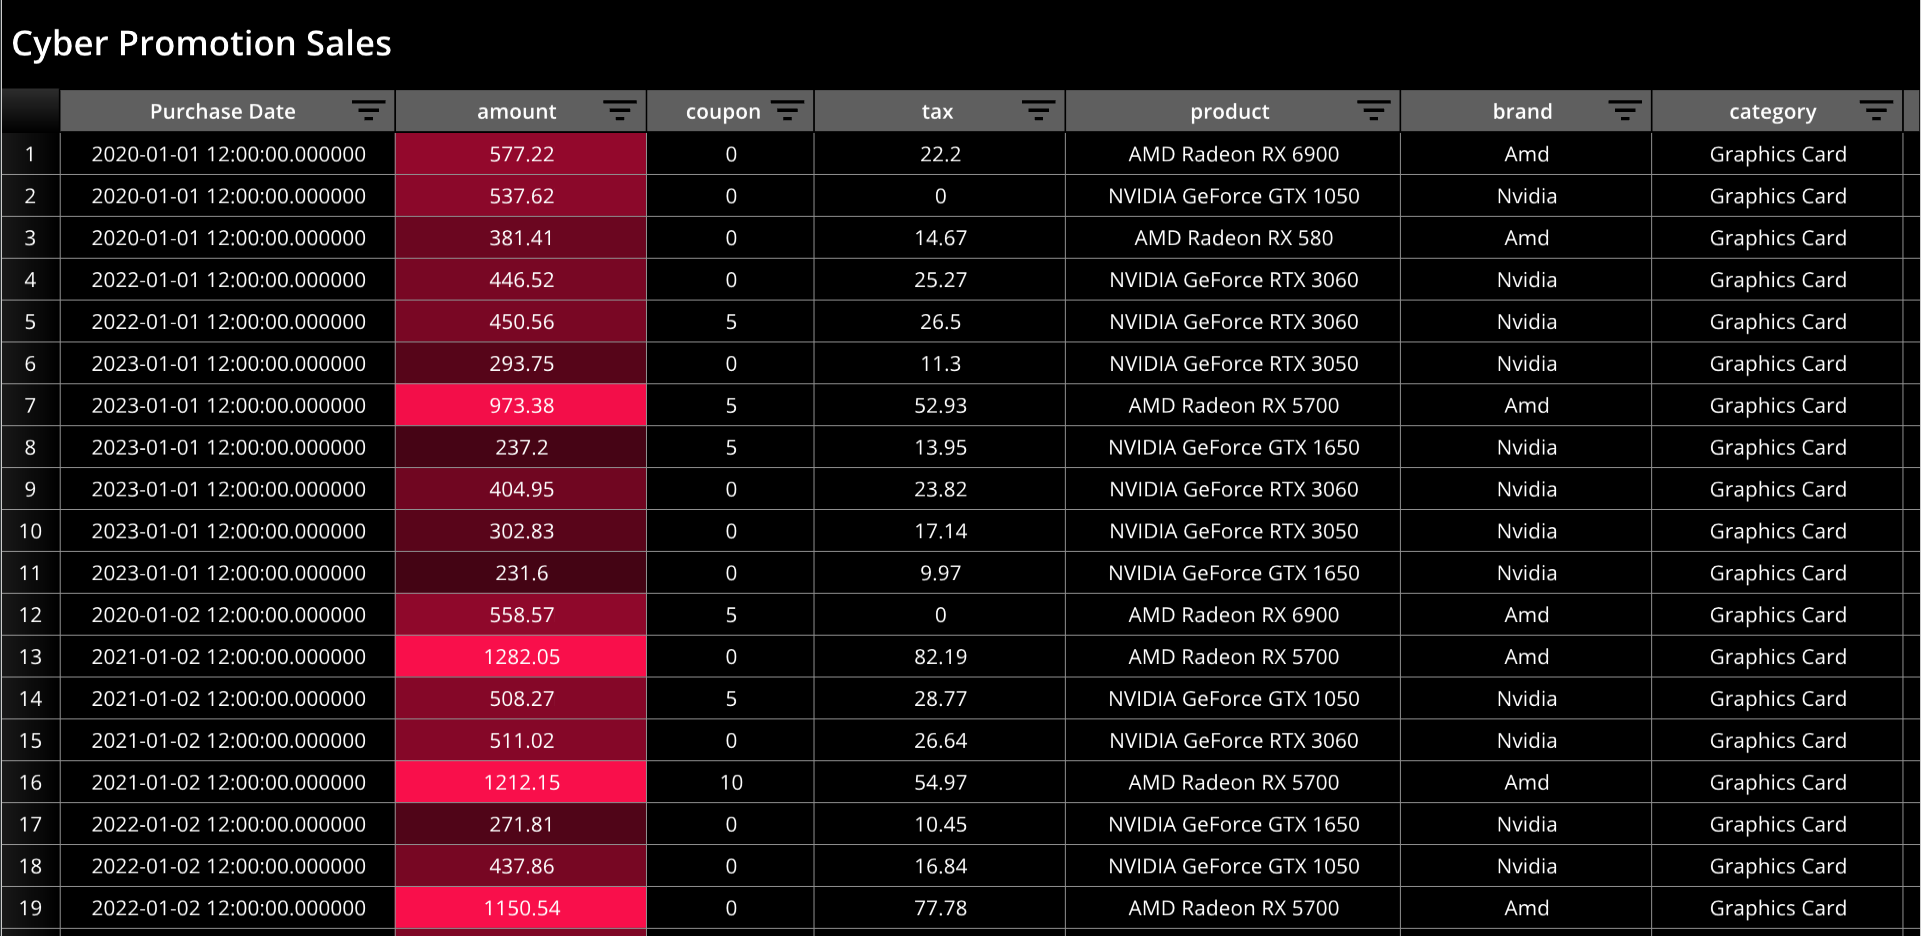
Modify a Dataframe
from row64tools.dash64 import dash64
dash = dash64("/var/www/dashboards/temp/dfmod.dash")
pList = [
    ["Main",       "",             "1600",     "900",  "y"]
]
dash.Layout.set_panes(pList)
dash.add_ramdb("/var/www/ramdb/live/RAMDB.Row64/Examples/HardwareSales.ramdb","DF1")
dfDef = [
    ["Format","Color",0x000000],
    ["Format","HeaderBar", "Color",  0x5F5F5F],
    ["Format","HeaderBar", "TxtColor", 0xFFFFFF],
    ["Layout","Zoom",1.78],
    ["Layout","Title","Cyber Promotion Sales"],
    ["Layout","TitleFont","Color",0xFFFFFF],
    ["Layout","TitleFont","Bold",True],
    ["Row","Height", 25],
    ["Column", 0, "DisplayName", "Purchase Date"],
    ["Column", 1, "Theme", [0x000000,0x64061e,0xa50a32,0xfa0f4c]],
    ["Column", 1, "Formula", "=B1/1000"],
    ["Column", 0, "Width", 200],
    ["Column", 2, "Width", 100],
    ["Column", 4, "Width", 200]
]
dash.add_df("DF1", "Main", dfDef)
dash.save()
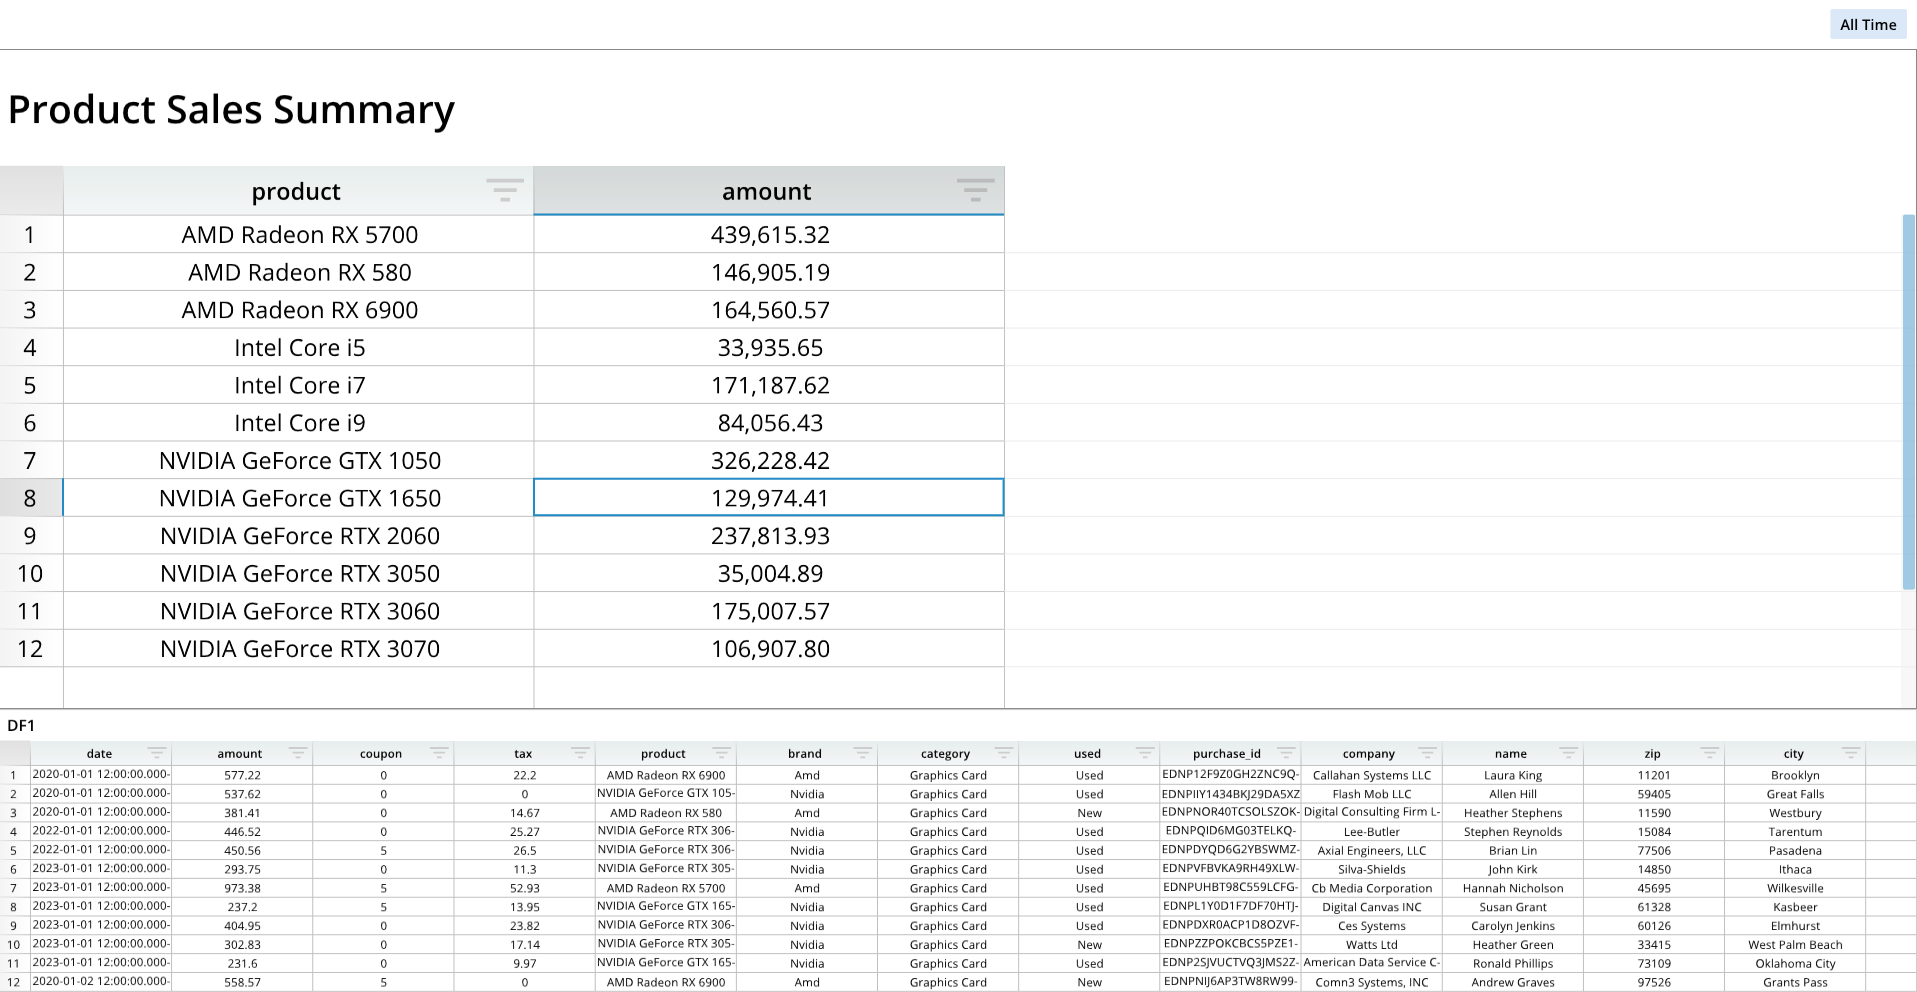
Data Node
from row64tools.dash64 import dash64
dash = dash64("/var/www/dashboards/temp/dnode.dash")
pList = [
    ["Dashboard",       "",             "1600",     "900",  "y"],
    ["TopPane",         "Dashboard",    "*",        "*",    ""],
    ["BottomPane",      "Dashboard",    "*",        "30%",  ""]
]
dash.Layout.set_panes(pList)
dash.add_ramdb("/var/www/ramdb/live/RAMDB.Row64/Examples/HardwareSales.ramdb","DF1")
dash.add_df("DF1", "BottomPane")
dnDef = [[ "CROSSLINK", ["DF1",1,4], ["df","col","col"] ],
         [ "GROUPSUM",  [1],         ["col"]            ]]
dash.add_datanode("DNode1", "DF1", dnDef)
paneDef = [
    ["Layout","Zoom",2.0],
    ["Layout","Title","Product Sales Summary"],
    ["Layout","TitleFont","Bold",True],
    ["Column", 0, "Width", 250],
    ["Column", 1, "Code", "#,###.00"],
    ["Column", 1, "Width", 250]
]
dash.add_df("DNode1", "TopPane", paneDef)
dash.save()
Dataframe and Data Node Options
For a full list of dataframe and data node options, please see the Dataframe Options page.
Charts and Diagrams
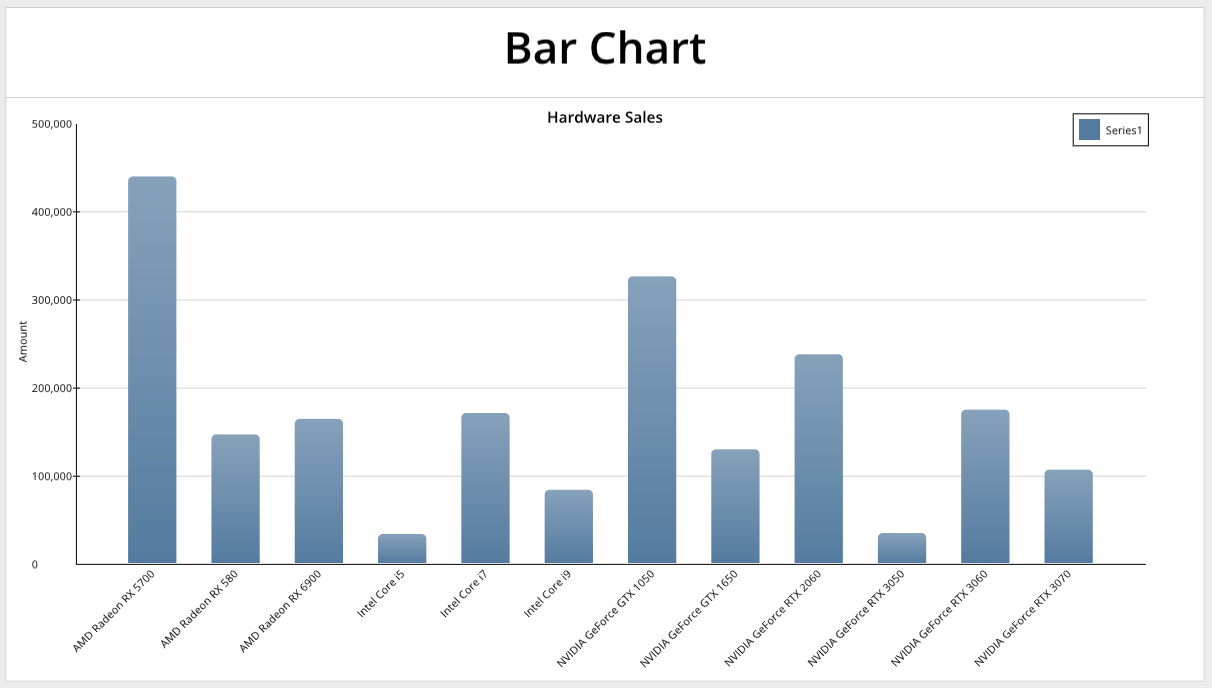
Bar Chart
from row64tools.dash64 import dash64
dash = dash64("/var/www/dashboards/temp/bar.dash")
pList = [
    ["Dashboard",       "",             "1600",     "900",  "y"],
    ["TopPane",         "Dashboard",    "*",        "*",    ""],
    ["BottomPane",      "Dashboard",    "*",        "50%",  ""]
]
dash.Layout.set_panes(pList)
dash.add_ramdb("/var/www/ramdb/live/RAMDB.Row64/Examples/HardwareSales.ramdb","DF1")
dash.add_df("DF1", "BottomPane")
dnDef = [[ "CROSSLINK", ["DF1",1,4], ["df","col","col"] ],
         [ "GROUPSUM",  [1],         ["col"]            ]]
dash.add_datanode("DNode1", "DF1", dnDef)

bDef = [[ "amount", "=DNode1!A:A", "=DNode1!B:B" ] ] # Name, Labels, Values
bOptions = [
    ["Format","AxisX","LabelRotation",-.35],
    ["Format","BarOrder",2],
    ["Details","Legend","Show",True],
    ["Details","Legend","Pos",[.88,.04]],
    ["Series",0,"Alphas",[0.8, 0.8, 0.8, 0.8]]
]
dash.add_bar("Bar1", "TopPane", bDef, bOptions)
dash.save()
For a full list of formatting options, please see the Bar Chart page.
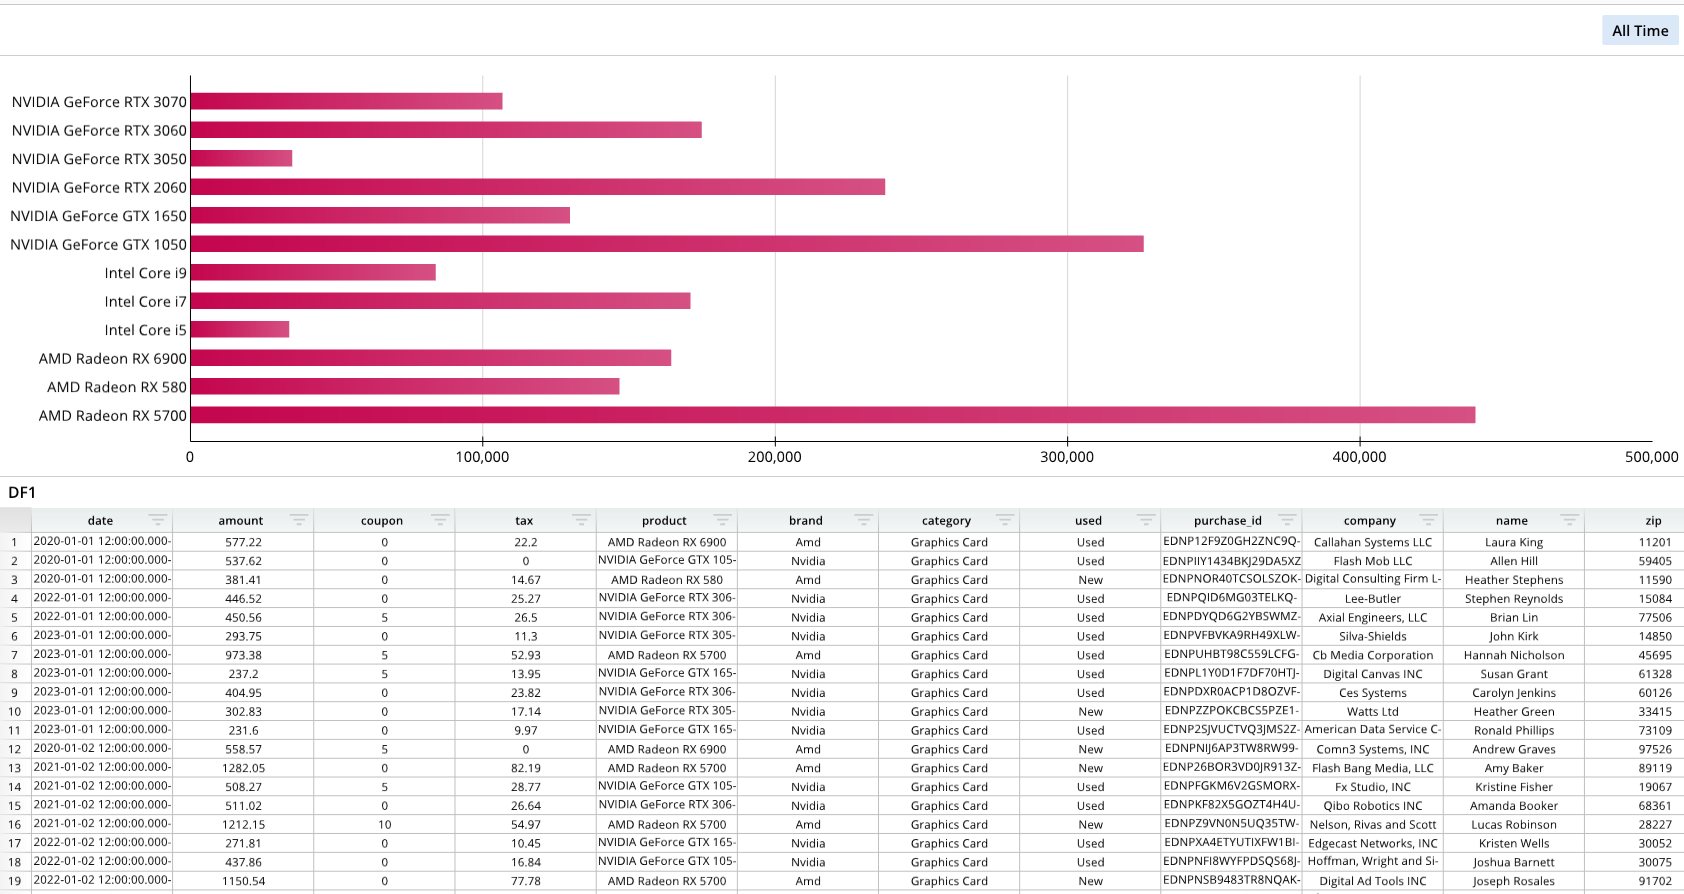
Horizontal Bar Chart
from row64tools.dash64 import dash64
dash = dash64("/var/www/dashboards/temp/hbar.dash")
pList = [
    ["Dashboard",       "",             "1600",     "900",  "y"],
    ["TopPane",         "Dashboard",    "*",        "*",    ""],
    ["BottomPane",      "Dashboard",    "*",        "50%",  ""]
]
dash.Layout.set_panes(pList)
dash.add_ramdb("/var/www/ramdb/live/RAMDB.Row64/Examples/HardwareSales.ramdb","DF1")
dash.add_df("DF1", "BottomPane")
dnDef = [[ "CROSSLINK", ["DF1",1,4], ["df","col","col"] ],
         [ "GROUPSUM",  [1],         ["col"]            ]]
dash.add_datanode("DNode1", "DF1", dnDef)
bDef = [[ "amount", "=DNode1!A:A", "=DNode1!B:B" ] ] # Name, Labels, Values
bOptions = [
    ["Series",0,"Colors",[0xc4064e, 0xc4064e, 0xc4064e, 0xc4064e]]
]
dash.add_hbar("Bar1", "TopPane", bDef, bOptions)
dash.save()
For a full list of formatting options, please see the Bar Chart page. Horizontal bar charts share the same formatting options as regular bar charts.
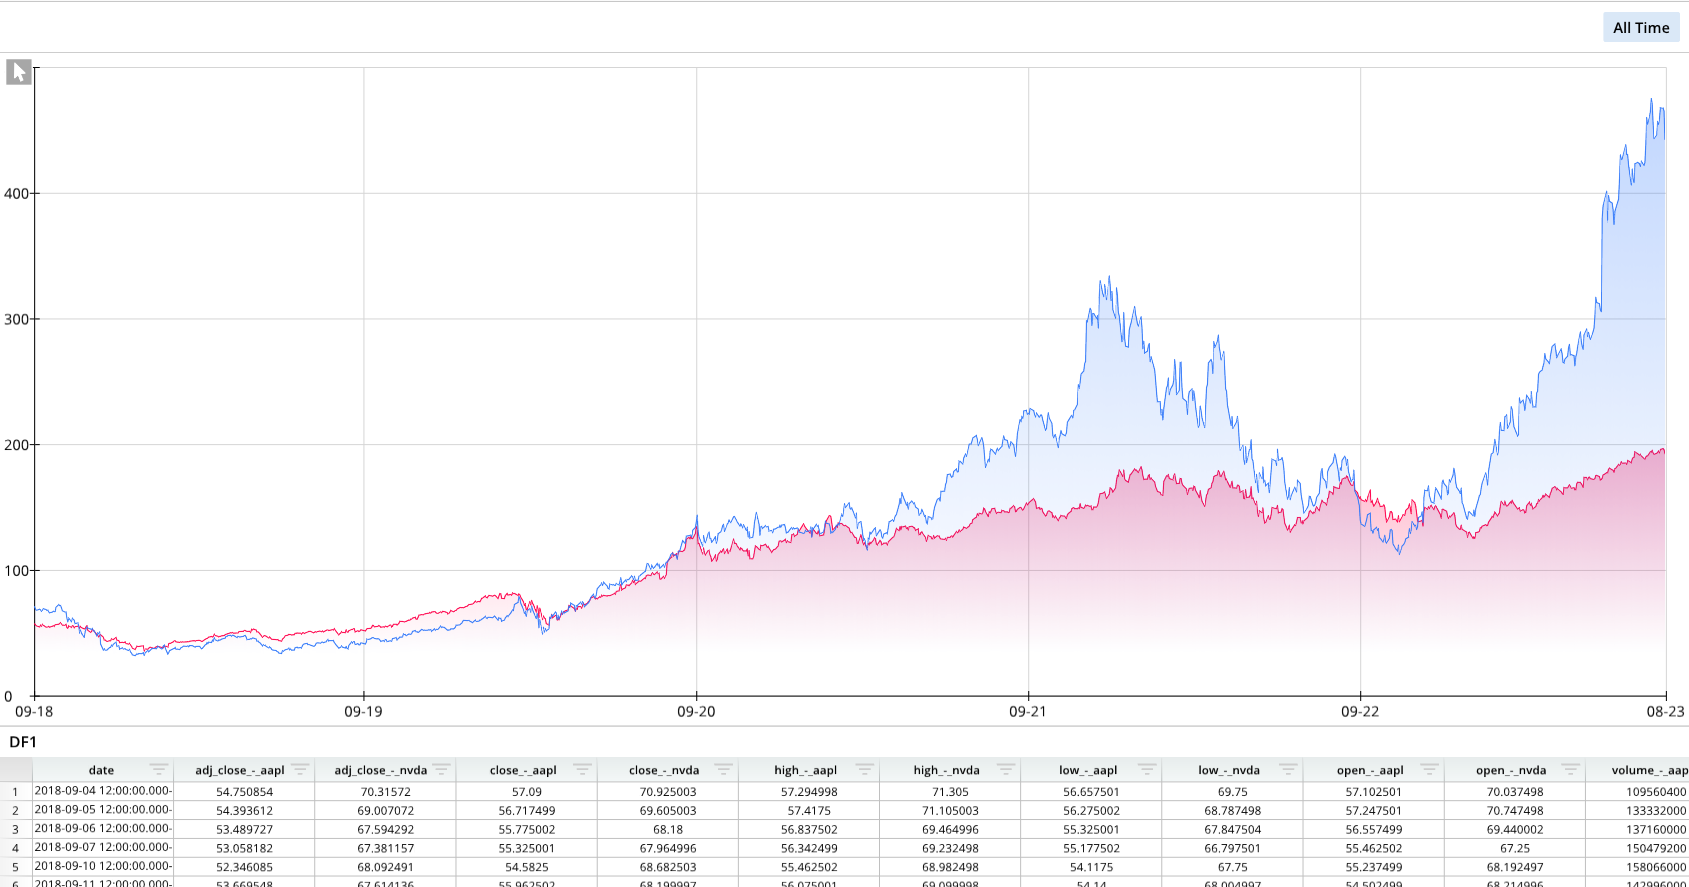
Line Chart
from row64tools.dash64 import dash64
dash = dash64("/var/www/dashboards/temp/line.dash")
pList = [
    ["Dashboard",       "",             "1600",     "900",  "y"],
    ["TopPane",         "Dashboard",    "*",        "*",    ""],
    ["BottomPane",      "Dashboard",    "*",        "20%",  ""]
]
dash.Layout.set_panes(pList)
dash.add_ramdb("/var/www/ramdb/live/RAMDB.Row64/Examples/MultipleStocks.ramdb","DF1")
dash.add_df("DF1", "BottomPane")
lDef = [
    [ "AAPL", "=DF1!A:A", "=DF1!D:D" ], # Name, Labels, Values
    [ "NVDA", "=DF1!A:A", "=DF1!E:E" ]
]
lOptions = [
    ["Format","GridlineX","Type",2],  # Categorical:0, Numeric:1, DateTime:2
    ["Format","AxisX","LabelFormat","mm-yy"],
    ["Series",0,"Line","Color", 0xFF004A],  # 0x3178FA
    ["Series",0,"FillType",2], # 0=None, 1=Fill, 2=Gradient
    ["Series",0,"Fill","Color",0xFF004A],
    ["Series",0,"Fill","Alpha",.3],
    ["Series",1,"Line","Color", 0x3178FA],
    ["Series",1,"FillType",2],
    ["Series",1,"Fill","Color",0x3178FA],
    ["Series",1,"Fill","Alpha",.3]
]
dash.add_line("Line1", "TopPane", lDef, lOptions)
dash.save()
For a full list of formatting options, please see the Line Chart page.
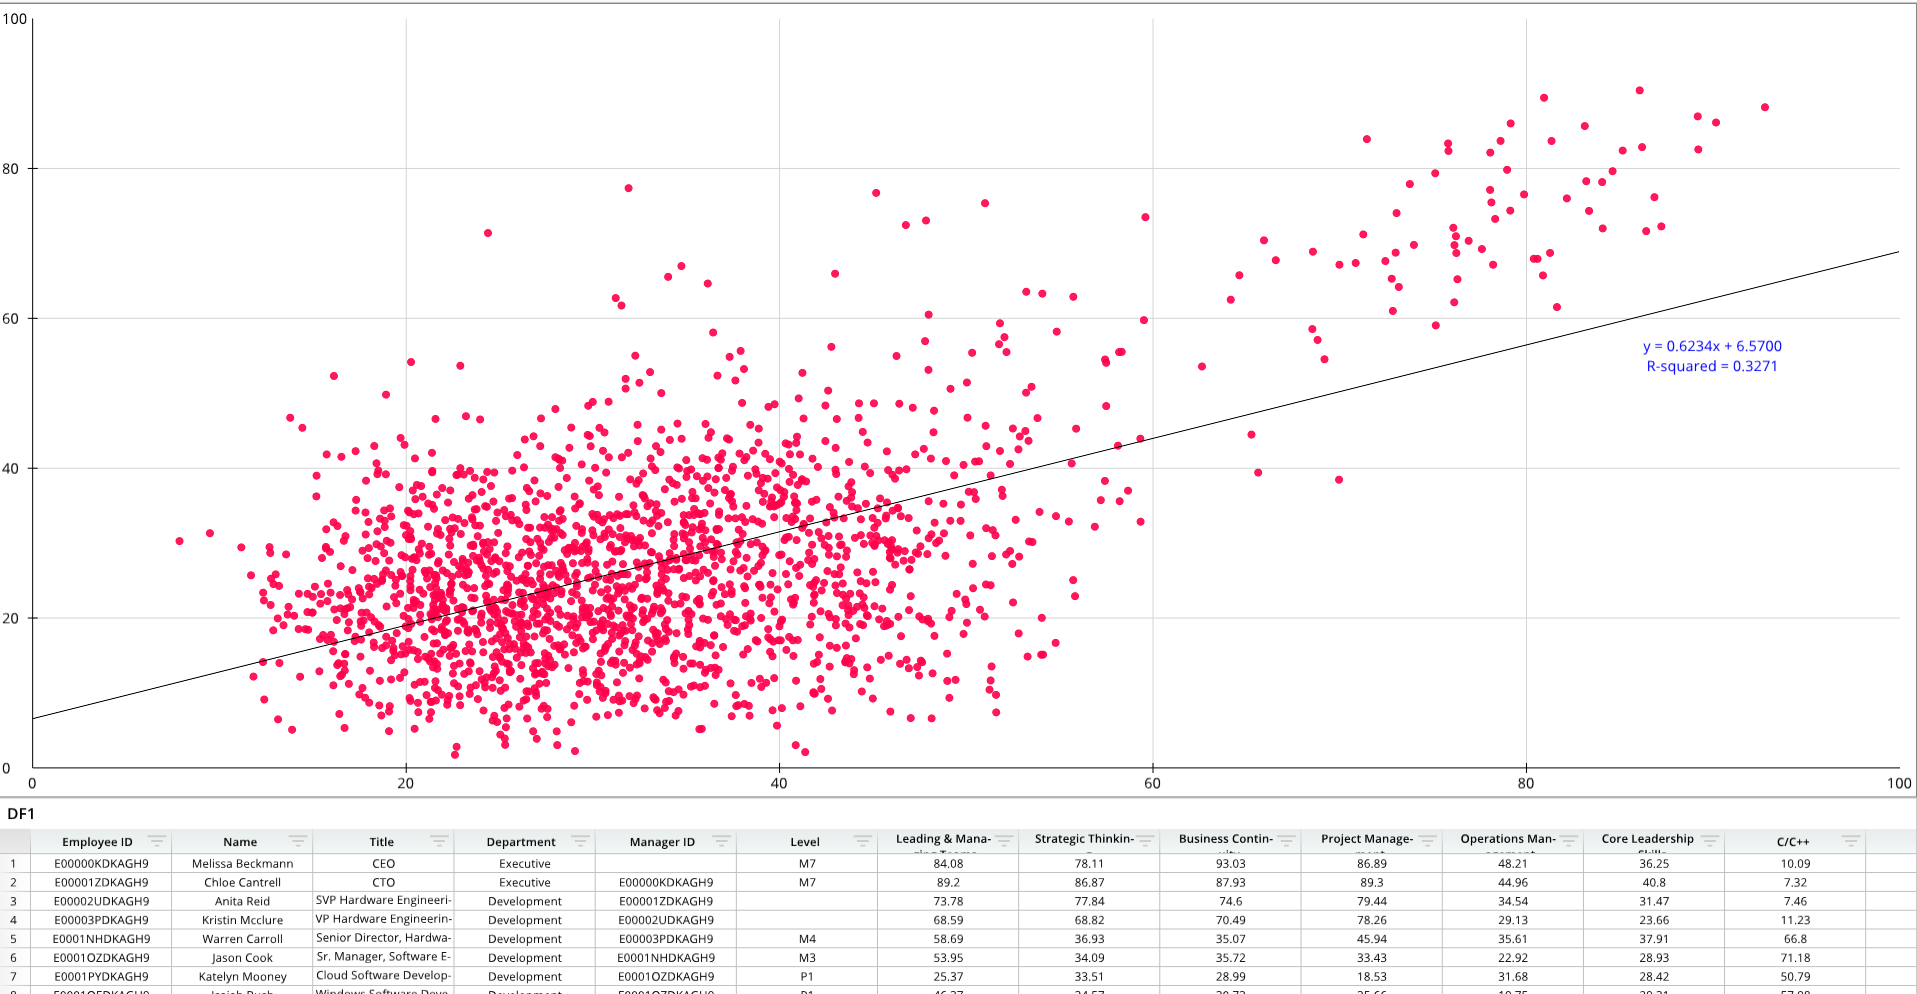
Scatter Plot
from row64tools.dash64 import dash64
dash = dash64("/var/www/dashboards/temp/scatter.dash")
pList = [
    ["Dashboard",       "",             "1600",     "900",  "y"],
    ["TopPane",         "Dashboard",    "*",        "*",    ""],
    ["BottomPane",      "Dashboard",    "*",        "20%",  ""]
]
dash.Layout.set_panes(pList)
dash.add_ramdb("/var/www/ramdb/live/RAMDB.Row64/Examples/Skill_Flow.ramdb","DF1")
dash.add_df("DF1", "BottomPane")
sDef = [ [ "", "", "=DF1!G:G", "=DF1!H:H" ] ] # Name, Labels, X Values, Y Values
sOptions = [
    ["Series",0,"Marker","Color", 0xFF004A],
    ["Series",0,"Marker","Size", 8],
    ["Series",0,"Marker","Alpha", .9],
    ["Series",0,"EQOptions","ShowTrendline", True],
    ["Series",0,"EQOptions","ShowR", True],
    ["Series",0,"EQOptions","Loc", [0.9, .45]],
    ["Series",0,"EQOptions","ShowR", True],
    ["Series",0,"EQOptions","ShowEq",True],
    ["Series",0,"EQOptions","EquationF","Color",0x0000FF]
]
dash.add_scatter("Scatter1", "TopPane", sDef, sOptions)
dash.save()
For a full list of formatting options, please see the Scatter Plot page.
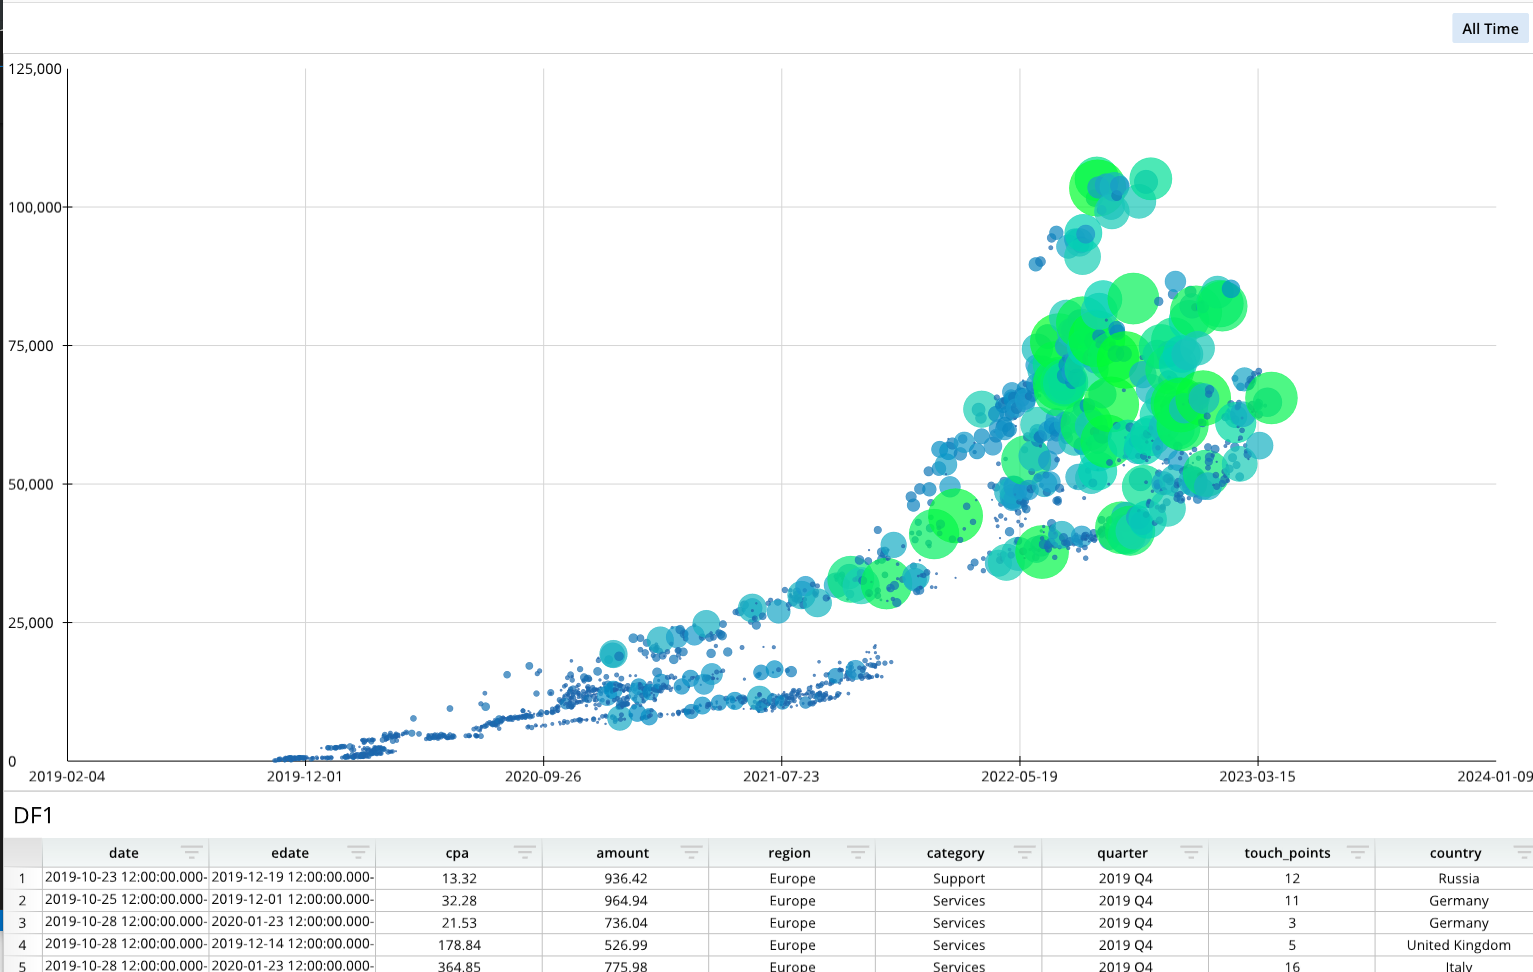
Bubble Chart
from row64tools.dash64 import dash64
dash = dash64("/var/www/dashboards/temp/bubble.dash")
pList = [
    ["Dashboard",       "",             "1600",     "900",  "y"],
    ["TopPane",         "Dashboard",    "*",        "*",    ""],
    ["BottomPane",      "Dashboard",    "*",        "20%",  ""]
]
dash.Layout.set_panes(pList)
dash.add_ramdb("/var/www/ramdb/live/RAMDB.Row64/Examples/CostPerAcquisition.ramdb","DF1")
dash.add_df("DF1", "BottomPane")
paneDef = [ ["Layout","Zoom",1.18] ]
dash.set_pane_def("BottomPane",paneDef)
bDef = [ [ "Series1", "", "=DF1!A:A", "=DF1!C:C", "=DF1!D:D" ] ] # Name, Labels, X Values, Y Values, Size Values
bOptions = [
    ["Format","AxisX","LabelFormat","yyyy-mm-dd"],
    ["Format","GridlineX","PreferZero",False], # bubble chart fit time range: PreferZero = False (don't fit zero in range)
    ["Details","Legend","ChipSize",3.2] # Max bubble size is set by Details > Legend > ChipSize
]
dash.add_bubble("Bubble1", "TopPane", bDef, bOptions)
dash.save()
For a full list of formatting options, please see the Bubble Chart page.
Word Cloud

from row64tools.dash64 import dash64
dash = dash64("/var/www/dashboards/temp/wordcloud.dash")
pList = [
    ["Dashboard",       "",             "1600",     "900",  "y"],
    ["TopPane",         "Dashboard",    "*",        "*",    ""],
    ["BottomPane",      "Dashboard",    "*",        "20%",  ""]
]
dash.Layout.set_panes(pList)
dash.add_ramdb("/var/www/ramdb/live/RAMDB.Row64/Examples/City_Locations.ramdb","DF1")
dash.add_df("DF1", "BottomPane")
cWidths = dash.Sheets.Items[ dash.Sheets.get_sheet_ind("DF1") ].ColumnWidths
cWidths[0] = 250 # set the paragraph text columns to be wider
cWidths[1] = 300
paneDef = [
    ["Layout","Zoom",1.18], # set the dataframe pane to zoom in
    ["Layout","ShowTitle",False] # set the dataframe pane to hide the title
]
dash.set_pane_def("BottomPane",paneDef)
wDef = [ ["", "=DF1!B:B", "=DF1!E:E", "" ] ] # Title, Words, Frequencies, Sentiments
wOptions = [
    ["Details", "ColorTheme",[0xaf4425,0x662e1c,0xc9a66b,0xebdcb2]],
    ["Details", "Layout", "ChartFill","Color",0x222222], # background to dark grey
    ["Format", "PreferHorizontal", .53],
    ["Format", "WordDensity", 1.5],
]
dash.add_wordcloud("wcloud1", "TopPane", wDef, wOptions)
dash.save()
For a full list of formatting options, please see the Word Cloud page.
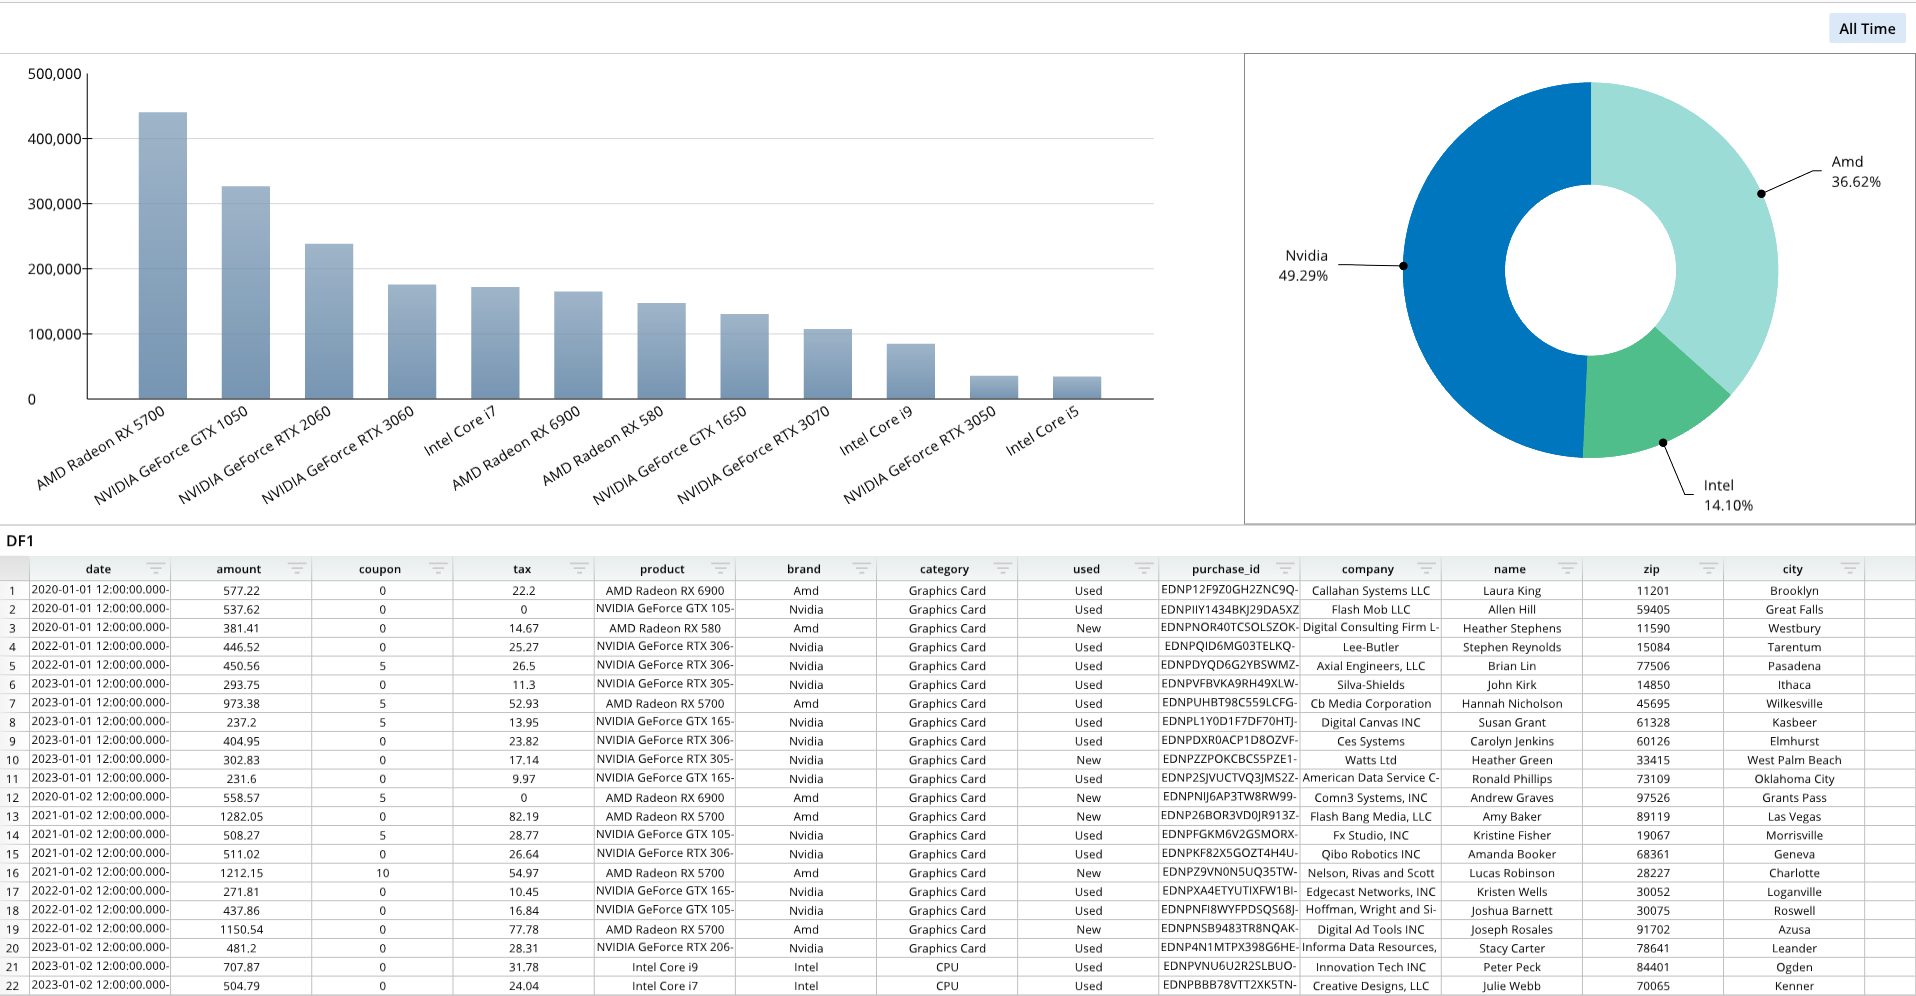
Pie Chart
from row64tools.dash64 import dash64
dash = dash64("/var/www/dashboards/temp/piebar.dash")
pList = [
    ["Dashboard",       "",         "1000", "800",  "y"],
    ["TopPane",         "Dashboard",        "*",        "50%",  "x"],
    ["BottomPane",  "Dashboard",        "*",        "*",    ""],
    ["LeftPane",        "TopPane",      "*",        "*",    ""],
    ["RightPane",       "TopPane",      "35%",      "*",    ""]
]
dash.Layout.set_panes(pList)
dash.add_ramdb("/var/www/ramdb/live/RAMDB.Row64/Examples/HardwareSales.ramdb","DF1")
dash.add_df("DF1", "BottomPane")
dnDef = [[ "CROSSLINK", ["DF1",1,4], ["df","col","col"] ],
         [ "GROUPSUM",  [1],         ["col"]            ]]
dash.add_datanode("DNode1", "DF1", dnDef)
bDef = [[ "amount", "=DNode1!A:A", "=DNode1!B:B" ] ] # Name, Labels, Values
bOptions = [
    ["Format","AxisX","LabelRotation",-.35],
    ["Format","BarOrder",2],
    ["Details","Legend","Show",True],
    ["Details","Legend","Pos",[.88,.04]],
    ["Series",0,"Alphas",[0.8, 0.8, 0.8, 0.8]]
]
dash.add_bar("Bar1", "LeftPane", bDef, bOptions)
dnDef2 = [[ "CROSSLINK", ["DF1",1,5], ["df","col","col"] ],
         [ "GROUPSUM",  [1],         ["col"]            ]]
dash.add_datanode("DNode2", "DF1", dnDef2)
pDef = [[ "amount", "=DNode2!A:A", "=DNode2!B:B" ] ]  # Name, Labels, Values
dash.add_pie("Pie1", "RightPane", pDef, [])
dash.save()
For a full list of formatting options, please see the Pie Chart page.
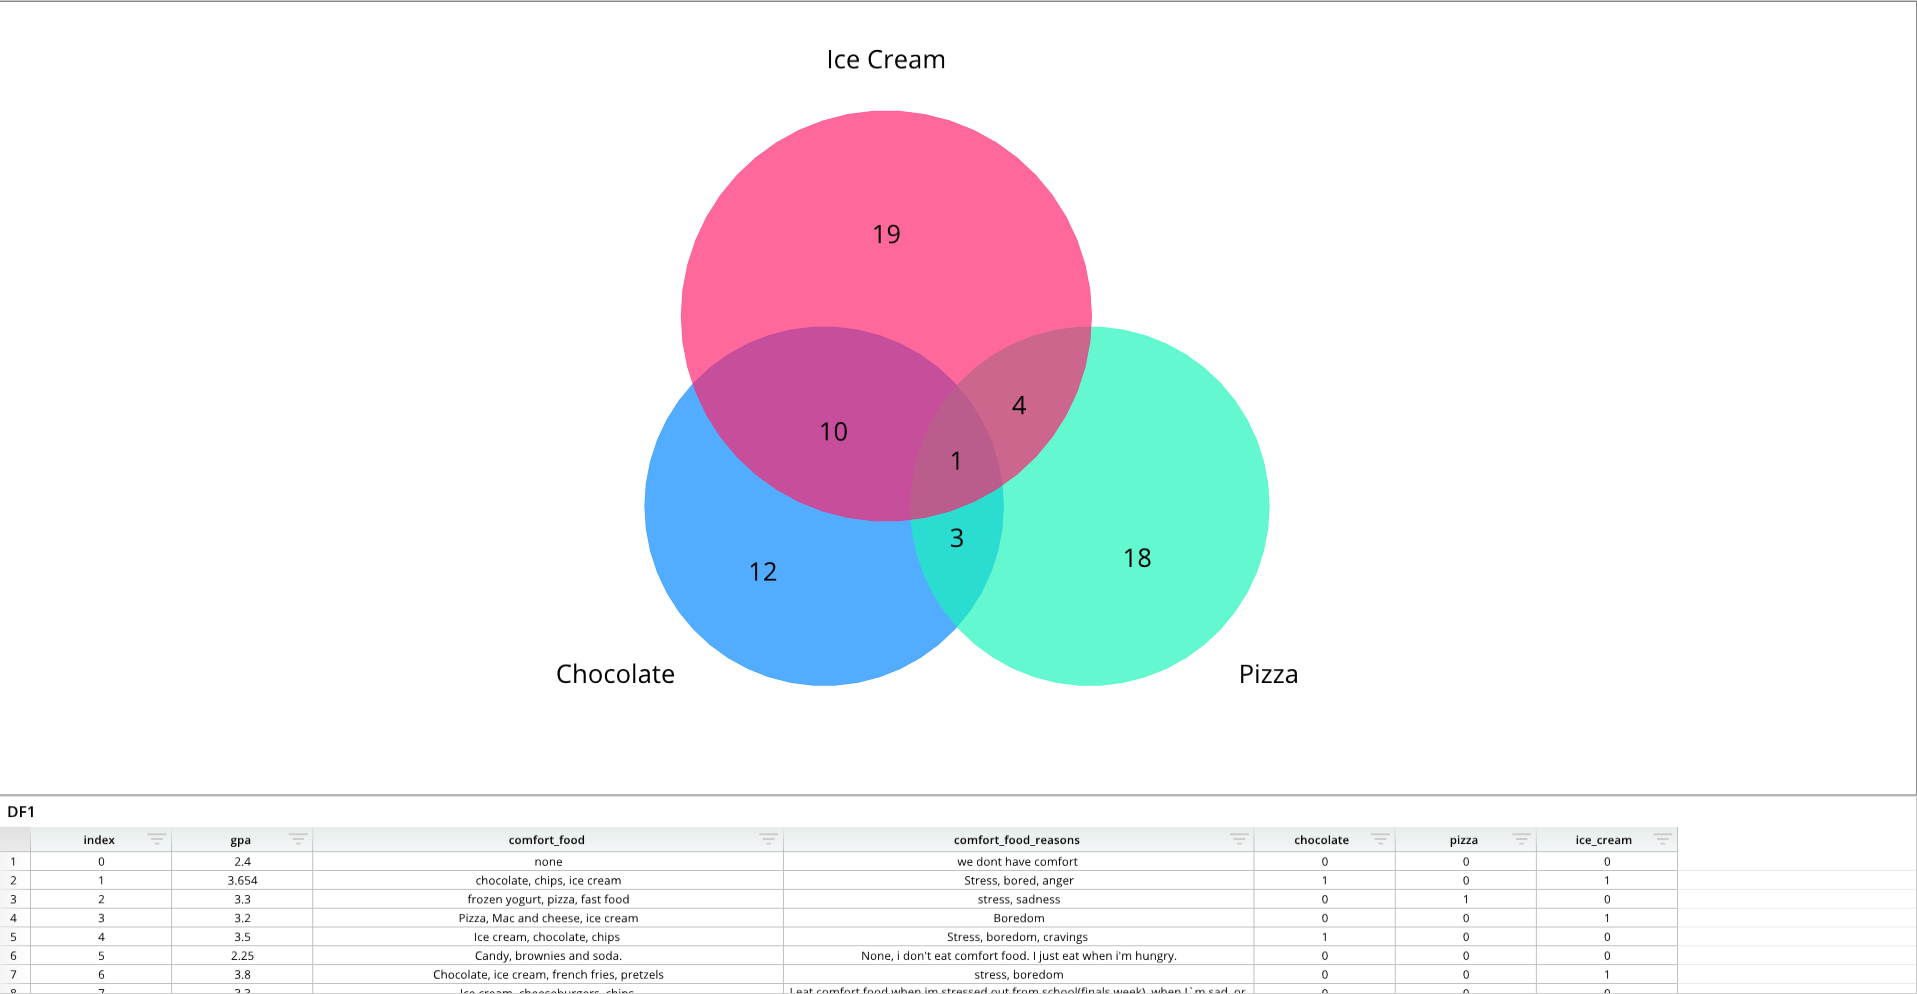
Venn Diagram
from row64tools.dash64 import dash64
dash = dash64("/var/www/dashboards/temp/venn.dash")
pList = [
    ["Dashboard",       "",             "1600",     "900",  "y"],
    ["TopPane",         "Dashboard",    "*",        "*",    ""],
    ["BottomPane",      "Dashboard",    "*",        "20%",  ""]
]
dash.Layout.set_panes(pList)
dash.add_ramdb("/var/www/ramdb/live/RAMDB.Row64/Examples/FoodGPA.ramdb","DF1")
dash.add_df("DF1", "BottomPane")
dInd = dash.Sheets.get_sheet_ind("DF1")
cWidths = dash.Sheets.Items[dInd].ColumnWidths
cWidths[2] = 500 # set the paragraph text columns to be wider
cWidths[3] = 500
vDef = [
    [ "Values", "=DF1!E:E", "=DF1!F:F", "=DF1!G:G" ],
    [ "Labels","Chocolate","Pizza","Ice Cream"]
]
vOptions = [
    ["Format", "FlipVenn3", True],
    ["Format", "LabelShift", .17],
    ["Format", "PrimaryFont","Size", 35],
    ["Format", "SecondaryFont","Size", 35],
    ["Details", "ColorTheme",[0x0086ff,0x1ef4ba,0x00ffb9,0xff216c]],
]
dash.add_venn("Venn1", "TopPane", vDef, vOptions)
dash.save()
For a full list of formatting options, please see the Venn Diagram page.
Trellis
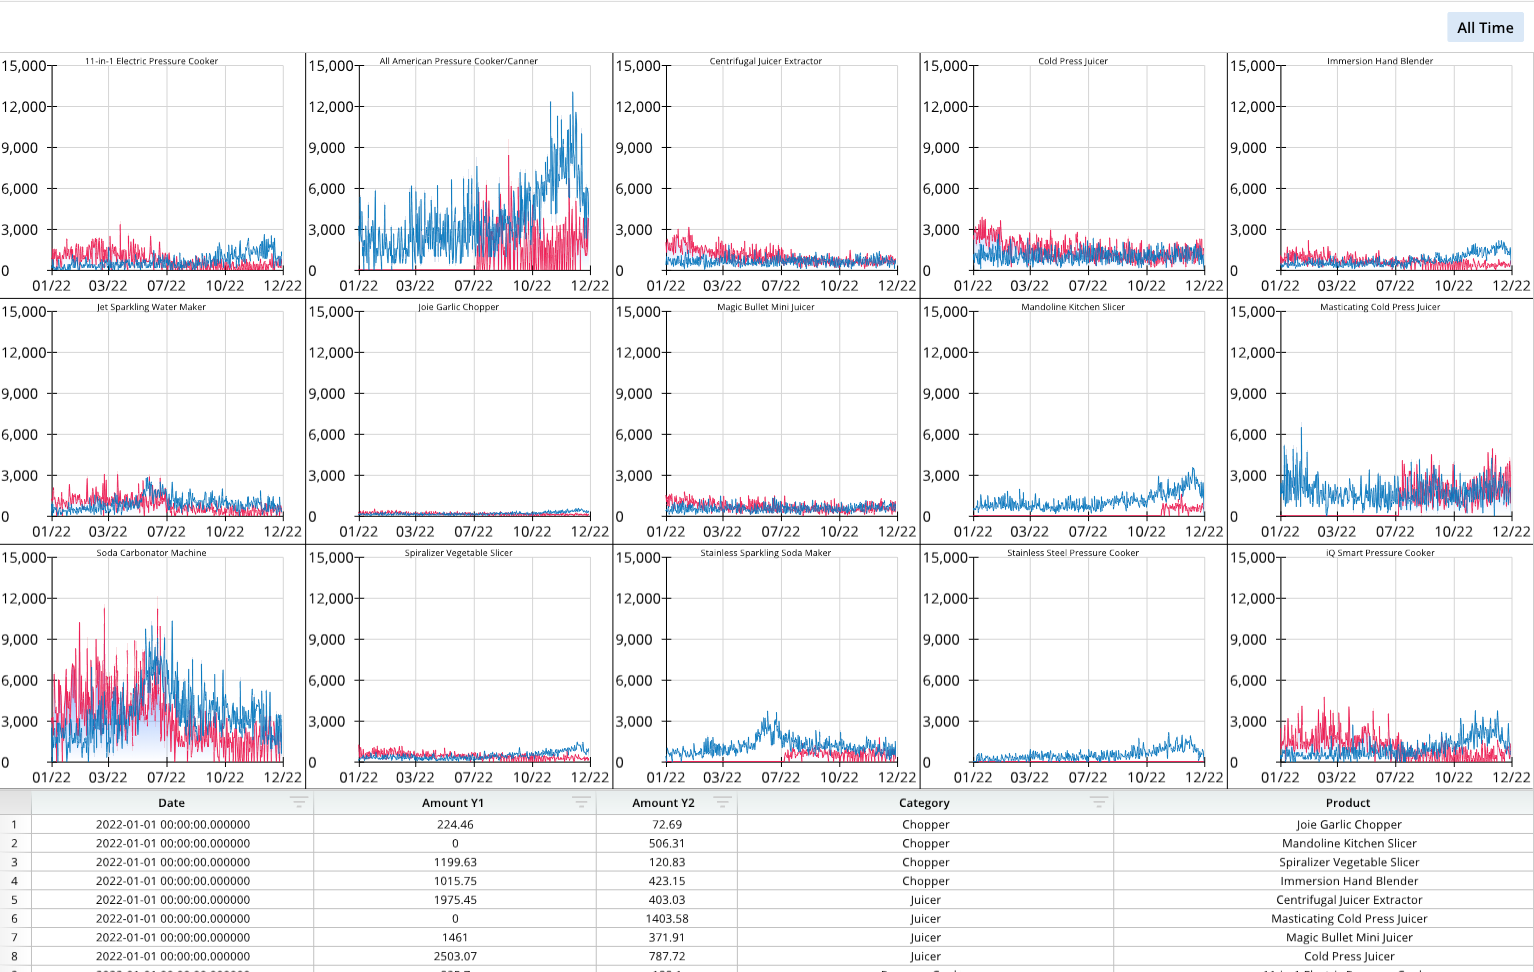
from row64tools.dash64 import dash64
dash = dash64("/var/www/dashboards/temp/trellis.dash")
pList = [
    ["Dashboard",       "",             "1600",     "900",  "y"],
    ["TopPane",         "Dashboard",    "*",        "*",    ""],
    ["BottomPane",      "Dashboard",    "*",        "20%",  ""]
]
dash.Layout.set_panes(pList)
dash.add_ramdb("/var/www/ramdb/live/RAMDB.Row64/Examples/Seasonal.ramdb","DF1")
dash.add_df("DF1", "BottomPane")
cWidths = dash.Sheets.Items[ dash.Sheets.get_sheet_ind("DF1") ].ColumnWidths
for i, w in zip([0,1,3,4],[300,300,400,500]):cWidths[i] = w # widen columns
dnDef2 = [[ "CROSSLINK", ["DF1",0,1,4], [10,8,8,8] ],
          [ "GROUPSUM",  [0,2],         [8,8]      ]]
dash.add_datanode("DNode2", "DF1", dnDef2)
dnDef3 = [[ "CROSSLINK", ["DF1",0,2,4], [10,8,8,8] ],
          [ "GROUPSUM",  [0,2],         [8,8]      ]]
dash.add_datanode("DNode3", "DF1", dnDef3)
paneDef = [ ["Layout","ShowTitle",False] ] # set the dataframe pane to hide the title
dash.set_pane_def("BottomPane",paneDef)
tDef = [
    ["", "=DNode2!A:A", "=DNode2!C:C", "=DNode2!B:B" ], # Line Chart Trellis: Name, Labels, Values, Index Value
    ["", "=DNode3!A:A", "=DNode3!C:C", "=DNode3!B:B" ]
]
tOptions = [
    ["Series", 0 ,"Line","Color",0xed1851],
    ["Series", 1 ,"Line","Color",0x0076bd],
    ["Series",0, "Fill","Color",0x3178FA],
    ["Series",0, "FillType",2],
    ["Format","Pad",3],
    ["Format","Line","AxisX","LabelFormat","mm/yy"],
    ["Format","Line","GridlineX","Type",2], #   Categorical:0, Numeric:1, DateTime:2
    ["Format","Line","GridlineX","AutoMajor",False],
    ["Format","Line","GridlineX","MajorBase",ord('M')], # uses ASCII value: 68 = 'D' day, 77 = 'M' month, 89 = 'Y' year
    ["Format","Line","GridlineX","MajorUnit",3]
]
dash.add_trellis("Line", "trellis1", "TopPane", tDef, tOptions)
dash.save()
For a full list of formatting options, please see the Trellis Chart page.
Diagram with Zoom
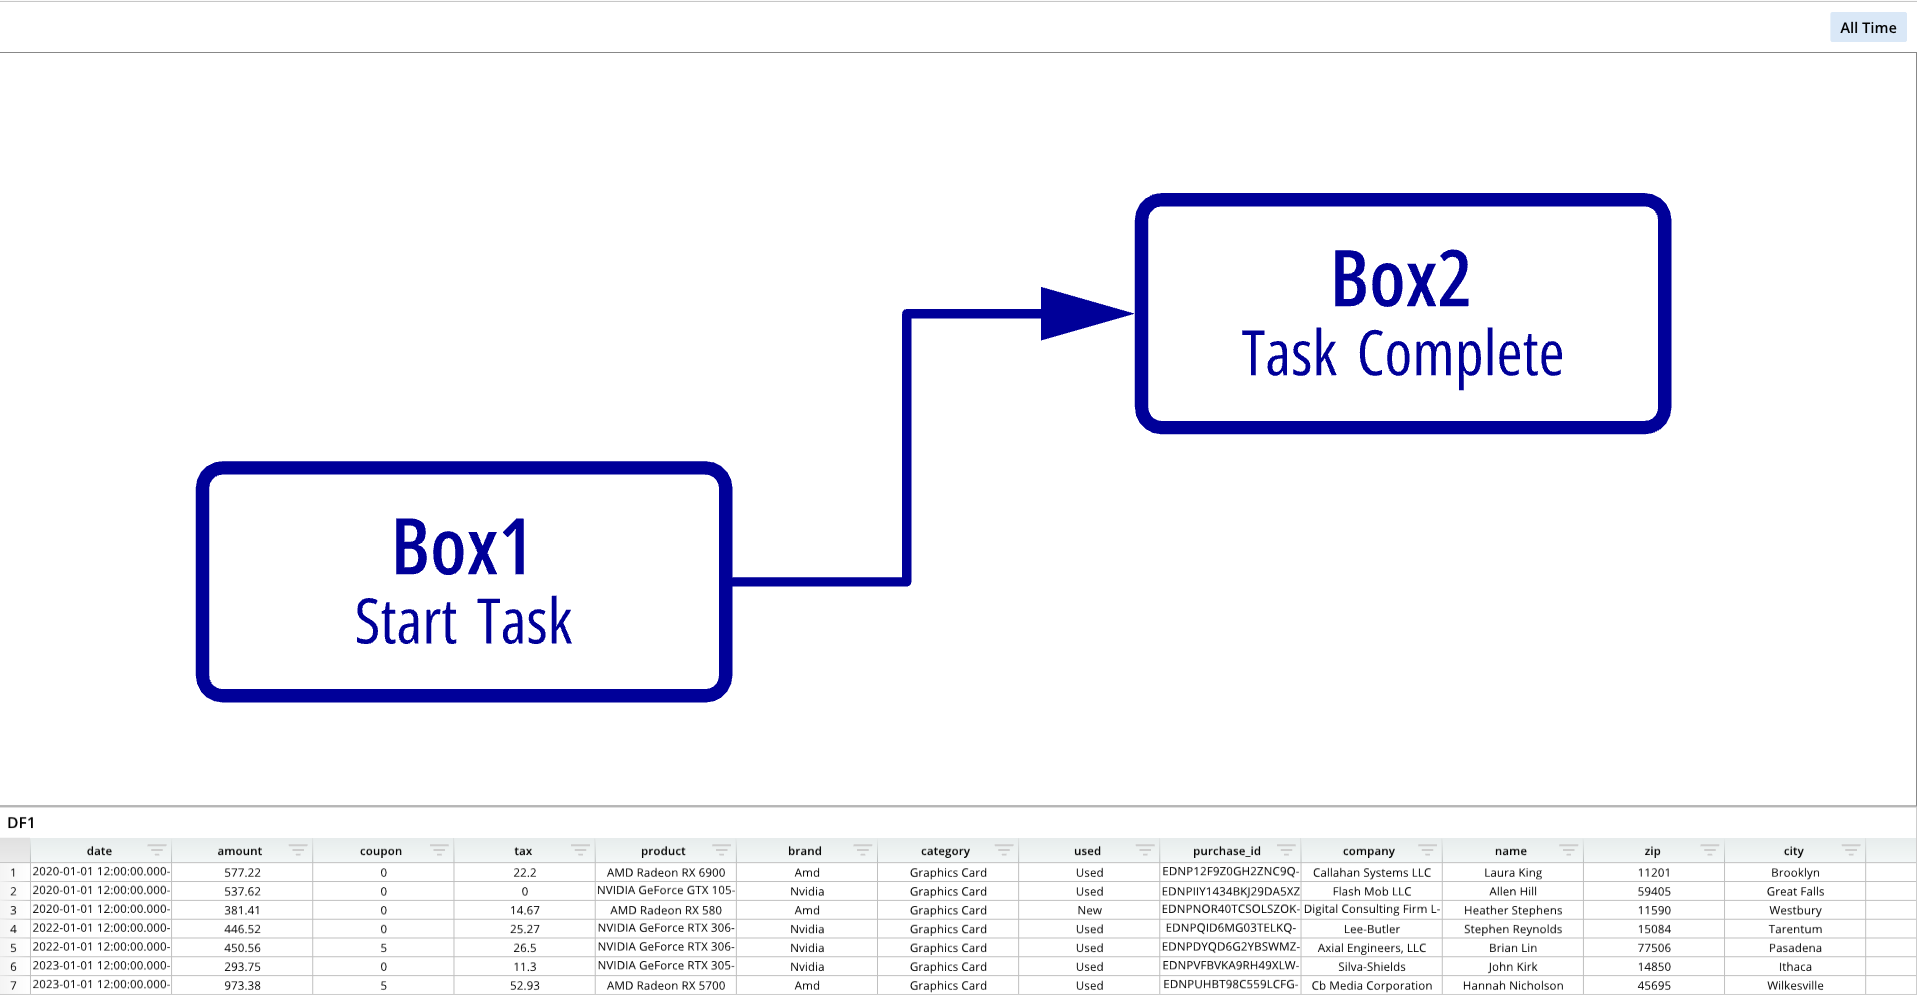
from row64tools.dash64 import dash64
import os
dash = dash64("/var/www/dashboards/temp/diagram.dash")
pList = [
    ["Dashboard",       "",             "1600",     "900",  "y"],
    ["TopPane",         "Dashboard",    "*",        "*",    ""],
    ["BottomPane",      "Dashboard",    "*",        "20%",  ""]
]
dash.Layout.set_panes(pList)
dash.add_ramdb("/var/www/ramdb/live/RAMDB.Row64/Examples/HardwareSales.ramdb","DF1")
dash.add_df("DF1", "BottomPane")
geoFile = os.path.join(dash.get_folder(), "Diagram.geo")
gDef = [["ProjectionMode",0]]
gShapes = [
    [
        ["File",geoFile],
        ["Name","Simple Diagram"],
        ["Color",0x000099]
    ]
]
gCords = []
dash.add_geo("GeoTab","TopPane",gDef,gShapes,gCords)
dash.save()
For a full list of formatting options, please see the Geo page. A diagram with zoom uses similar options as geo.
Geo
Geo with coordinate points
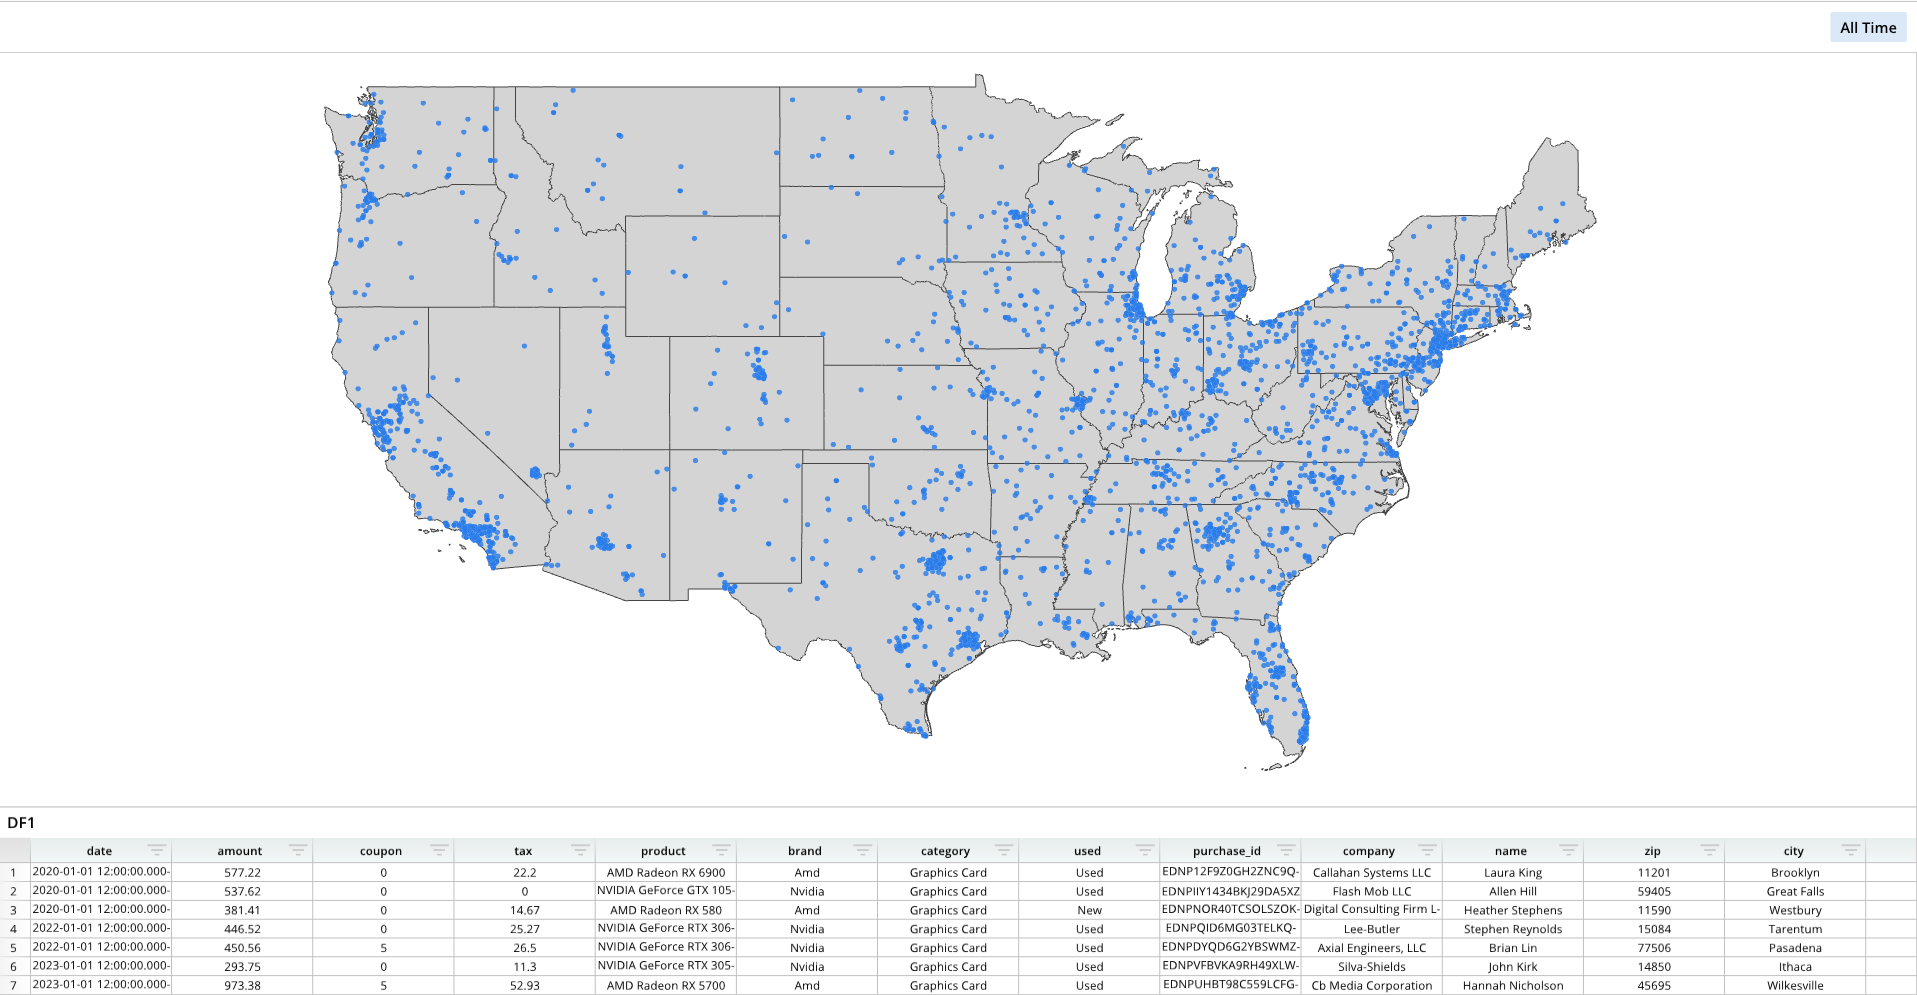
from row64tools.dash64 import dash64
import os
dash = dash64("/var/www/dashboards/temp/geo.dash")
pList = [
    ["Dashboard",       "",             "1600",     "900",  "y"],
    ["TopPane",         "Dashboard",    "*",        "*",    ""],
    ["BottomPane",      "Dashboard",    "*",        "20%",  ""]
]
dash.Layout.set_panes(pList)
dash.add_ramdb("/var/www/ramdb/live/RAMDB.Row64/Examples/HardwareSales.ramdb","DF1")
dash.add_df("DF1", "BottomPane")
gShapes = [
    [
        ["File",os.path.join(dash.get_folder(), "us_states_lines.geo")],
        ["Name","State Borders"],
        ["Color",0x444444]
    ],
    [
        ["File",os.path.join(dash.get_folder(), "us_states_poly.geo")],
        ["Name","Land"],
        ["Color",0xd4d4d4]
    ]
]
gCords = [
    [
        ["Name", "Hardware Sales"],
        ["Lat","=DF1!O:O"],
        ["Lon","=DF1!P:P"],
        ["Visible",True],
        ["Radius",6.5],
        ["Alpha", 0.8],
        ["Mode", "bubble_uniform"],
        ["Color", 0x287BE9],
        ["RingColor", 0xFFFFFF],
        ["RingSize", 0.1],
        ["ColorPalette", [ 0x1B617B, 0x2085A0, 0x46B1D3, 0xAFDEED ]],
        ["SpritePath", ""]
    ]
]
gDef = [
    ["ProjectionMode",1],
    ["ViewRects",[[15000.000000, 31567.729362, 31666.666667, 41085.522538]]],
    ["ViewNames", ["US Mainland"]]
]
dash.add_geo("GeoTab","TopPane", gDef, gShapes, gCords)
dash.save()
Geo with markers
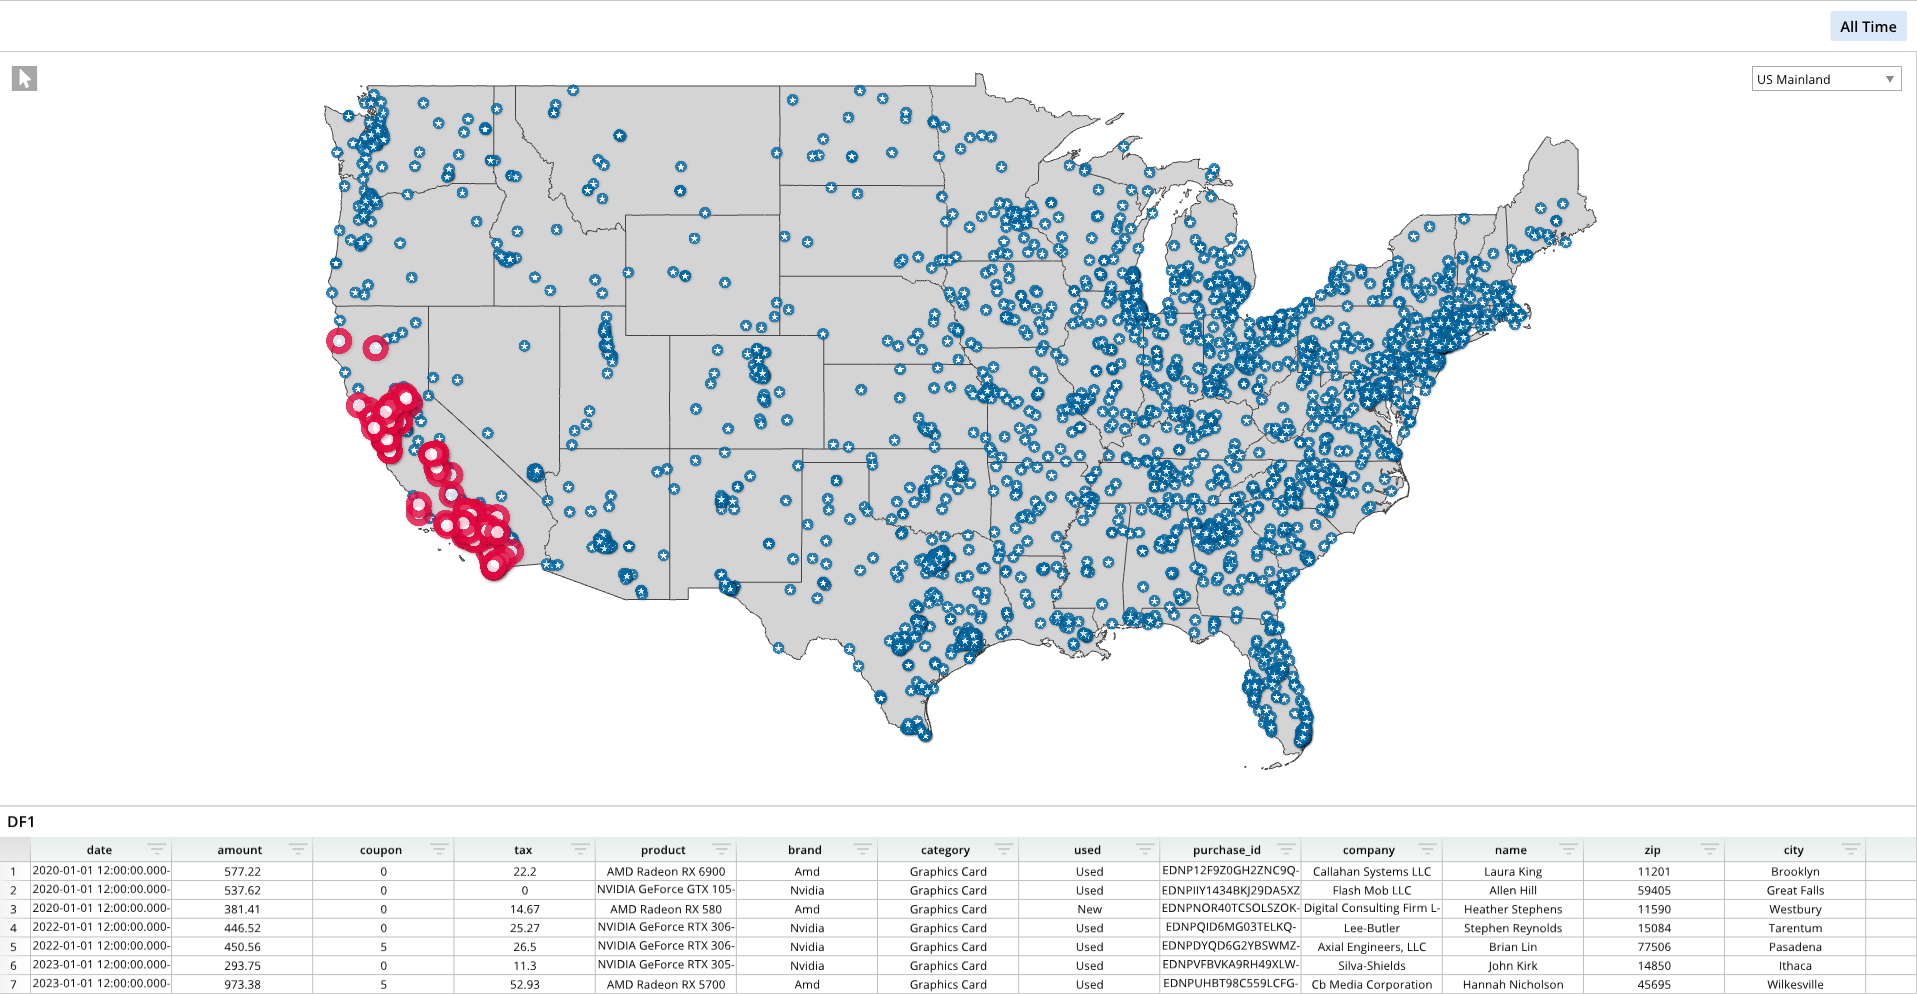
from row64tools.dash64 import dash64
import os
dash = dash64("/var/www/dashboards/temp/geosprite.dash")
pList = [
    ["Dashboard",       "",             "1600",     "900",  "y"],
    ["TopPane",         "Dashboard",    "*",        "*",    ""],
    ["BottomPane",      "Dashboard",    "*",        "20%",  ""]
]
dash.Layout.set_panes(pList)
dash.add_ramdb("/var/www/ramdb/live/RAMDB.Row64/Examples/HardwareSales.ramdb","DF1")
dash.add_df("DF1", "BottomPane")
dash.add_ramdb("/var/www/ramdb/live/RAMDB.Row64/Examples/Incident_Reports.ramdb","DF2")
gShapes = [
    [
        ["File",os.path.join(dash.get_folder(), "us_states_lines.geo")],
        ["Name","State Borders"],
        ["Color",0x444444]
    ],
    [
        ["File",os.path.join(dash.get_folder(), "us_states_poly.geo")],
        ["Name","Land"],
        ["Color",0xd4d4d4]
    ]
]
gCords = [
    [
        ["Name", "Incidents"],
        ["Lat","=DF2!D:D"],
        ["Lon","=DF2!E:E"],
        ["Visible",True],
        ["Radius",41.5],
        ["Alpha", 0.8],
        ["Mode", "sprite_uniform"],
        ["Color", 0xFFFFFF],
        ["RingColor", 0xFFFFFF],
        ["RingSize", 0.0],
        ["ColorPalette", [ 0xe3073f, 0x2085A0, 0x46B1D3, 0xAFDEED ]],
        ["SpritePath", "Dot_Red"]
    ],
    [
        ["Name", "Hardware Sales"],
        ["Lat","=DF1!O:O"],
        ["Lon","=DF1!P:P"],
        ["Visible",True],
        ["Radius",18.5],
        ["Alpha", 0.8],
        ["Mode", "sprite_uniform"],
        ["Color", 0xFFFFFF],
        ["RingColor", 0xFFFFFF],
        ["RingSize", 0.0],
        ["ColorPalette", [ 0x1B617B, 0x2085A0, 0x46B1D3, 0xAFDEED ]],
        ["SpritePath", "Star_Blue"]
    ]
]
gDef = [
    ["ProjectionMode",1],
    ["ViewRects",[[15000.000000, 31567.729362, 31666.666667, 41085.522538]]],
    ["ViewNames", ["US Mainland"]]
]
dash.add_geo("GeoTab","TopPane", gDef, gShapes, gCords)
dash.save()
Geo with shape attributes
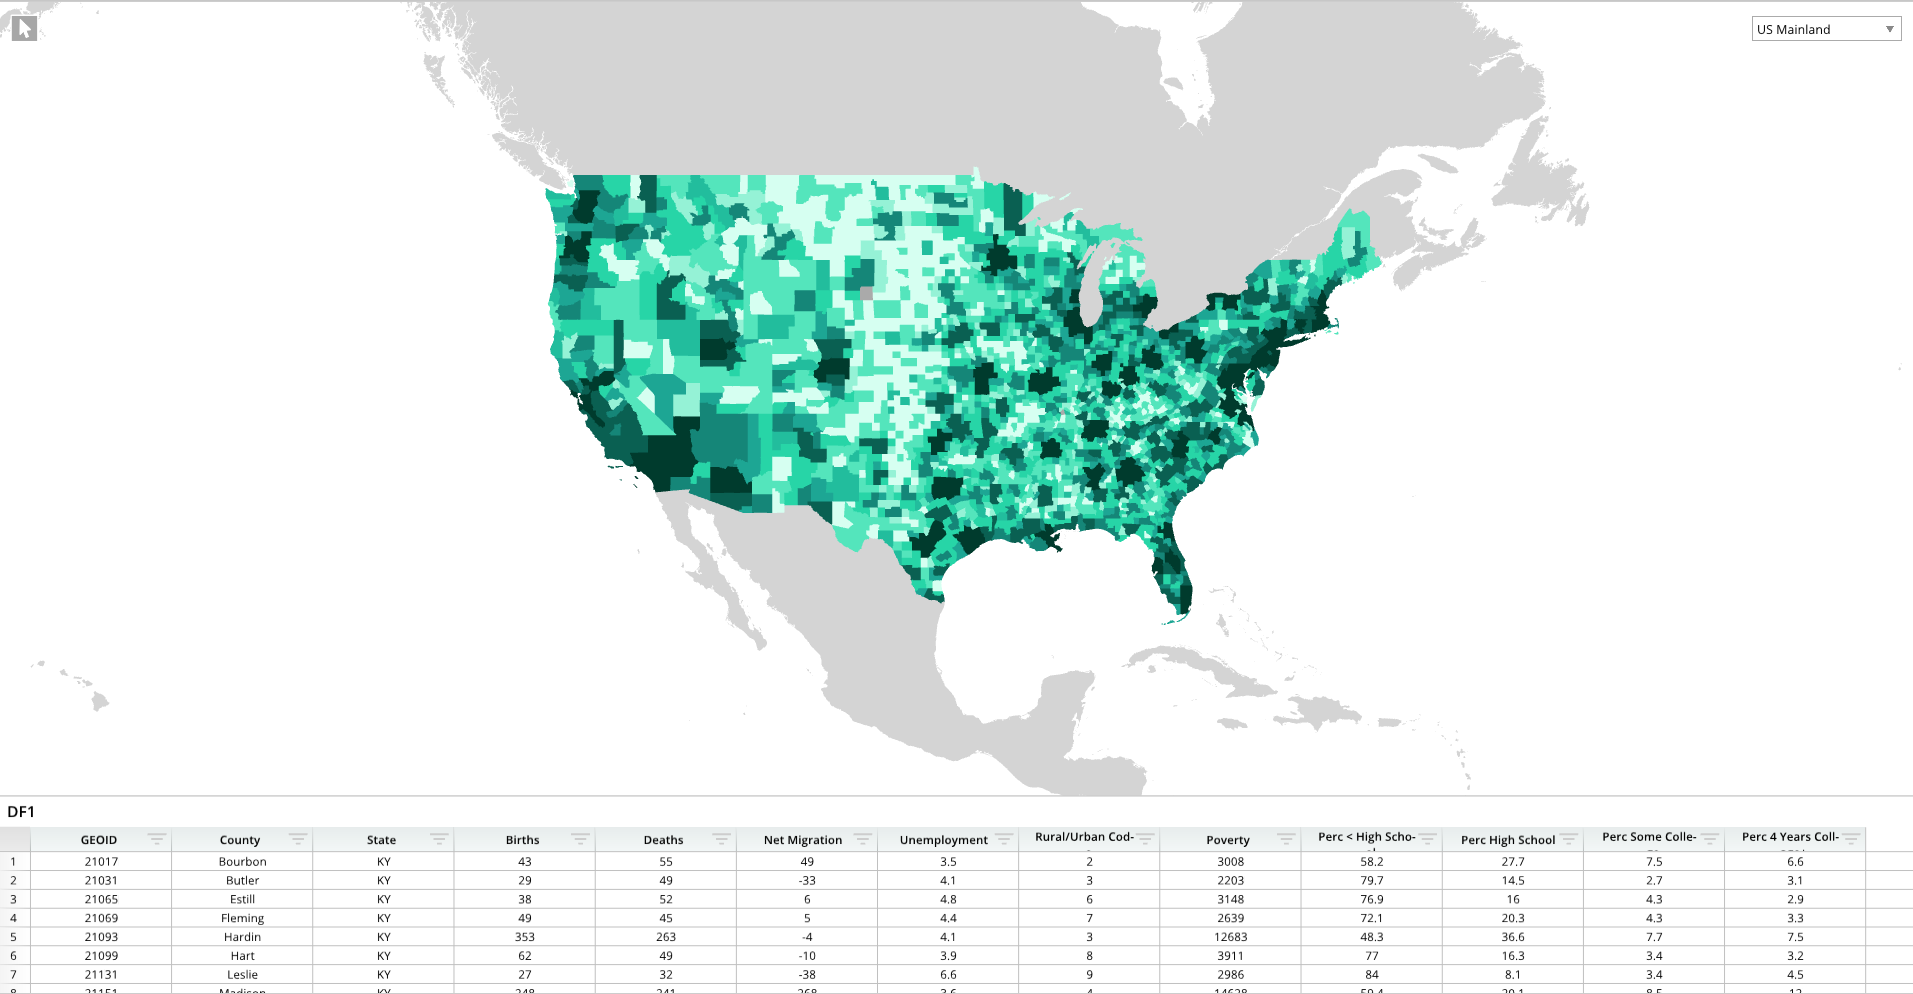
from row64tools.dash64 import dash64
import os
dash = dash64("/var/www/dashboards/temp/heatmap.dash")
pList = [
    ["Dashboard",       "",             "1600",     "900",  "y"],
    ["TopPane",         "Dashboard",    "*",        "*",    ""],
    ["BottomPane",      "Dashboard",    "*",        "20%",  ""]
]
dash.Layout.set_panes(pList)
dash.add_ramdb("/var/www/ramdb/live/RAMDB.Row64/Examples/Census.ramdb","DF1")
dash.add_df("DF1", "BottomPane")
gShapes = [
    [
        ["File",os.path.join(dash.get_folder(), "us_county.geo")],
        ["Name","County"],
        ["Locations","=DF1!A:A"],
        ["ColorValues","=DF1!H:H"],
        ["FeatureIndex",1],
        ["Color",0xAAAAAA]
    ],
    [
        ["File",os.path.join(dash.get_folder(), "world.geo")],
        ["Name","World"],
        ["Color",0xd4d4d4]
    ]
]
gDef = [
    ["ProjectionMode",1],
    ["ViewRects",[[11245.754788, 28740.170740, 35255.283438, 43976.256955]]],
    ["ViewNames", ["US Mainland"]],
    ["ColorTheme", [0x003b2d, 0x1c9f91, 0x29ddab, 0xd7fff1 ]]
]
dash.add_geo("GeoTab","TopPane", gDef, gShapes, [])
dash.save()
Geo Format Options
For a full list of formatting options, please see the Geo page.
Spreadsheet
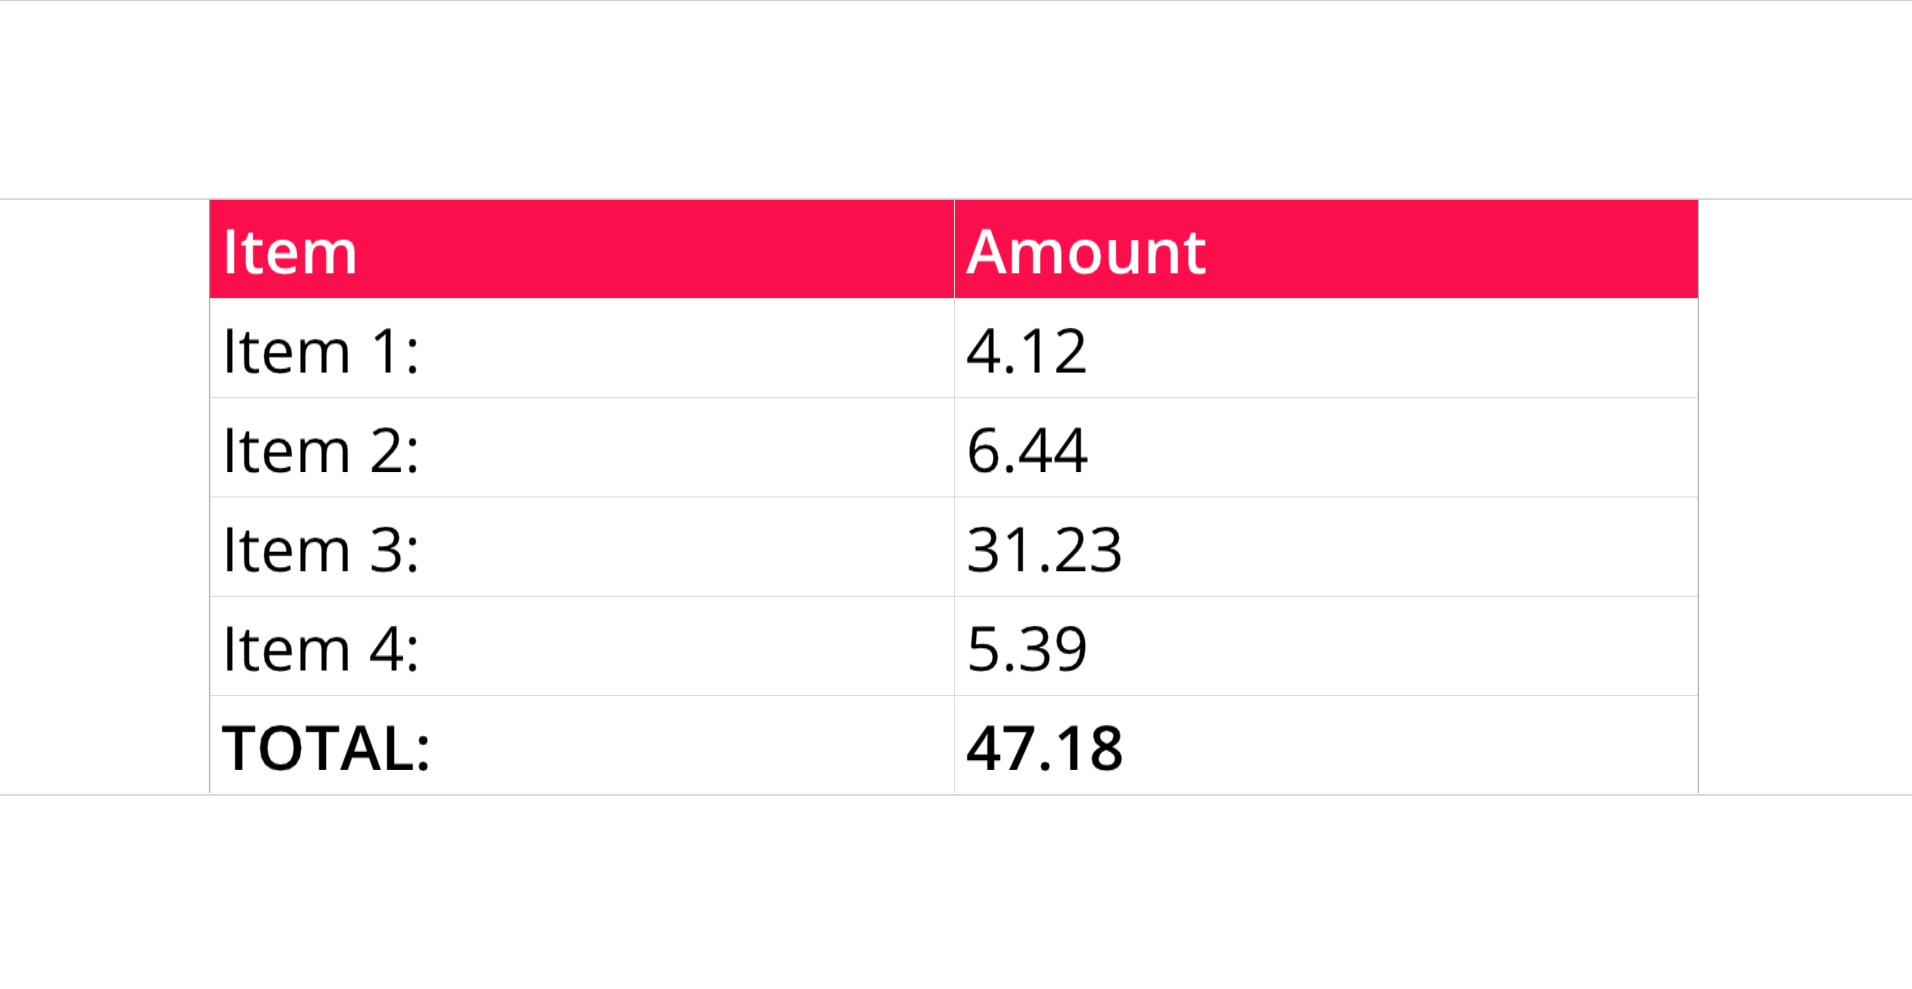
Single Spreadsheet
from row64tools.dash64 import dash64
dash = dash64("/var/www/dashboards/temp/ssheet.dash")
pList = [
    ["Main",            "",             "1600",     "900",  "y"],
    ["TopPane",         "Main",         "*",        "20%",  ""],
    ["MidPane",         "Main",         "*",        "*",    ""],
    ["BottomPane",      "Main",         "*",        "20%",  ""]
]
dash.Layout.set_panes(pList)
ssDef = [
["A1","Item","BCfa0f4cOFFFFFF"],["B1","Amount","BCfa0f4cOFFFFFF"],
    ["A2","Item 1:"],["B2",    "4.12"],
        ["A3","Item 2:"],["B3",    "6.44"],
        ["A4","Item 3:"],["B4",    "31.23"],
        ["A5","Item 4:"],["B5",    "5.39"],
        ["A6","TOTAL:","B"],["B6", "=SUM(B2:B5)","B","#,###.00"],
]
dim = [0, 0, 1, 5]
dash.add_spreadsheet("Sheet1", dim, ssDef, "MidPane")
dash.save()
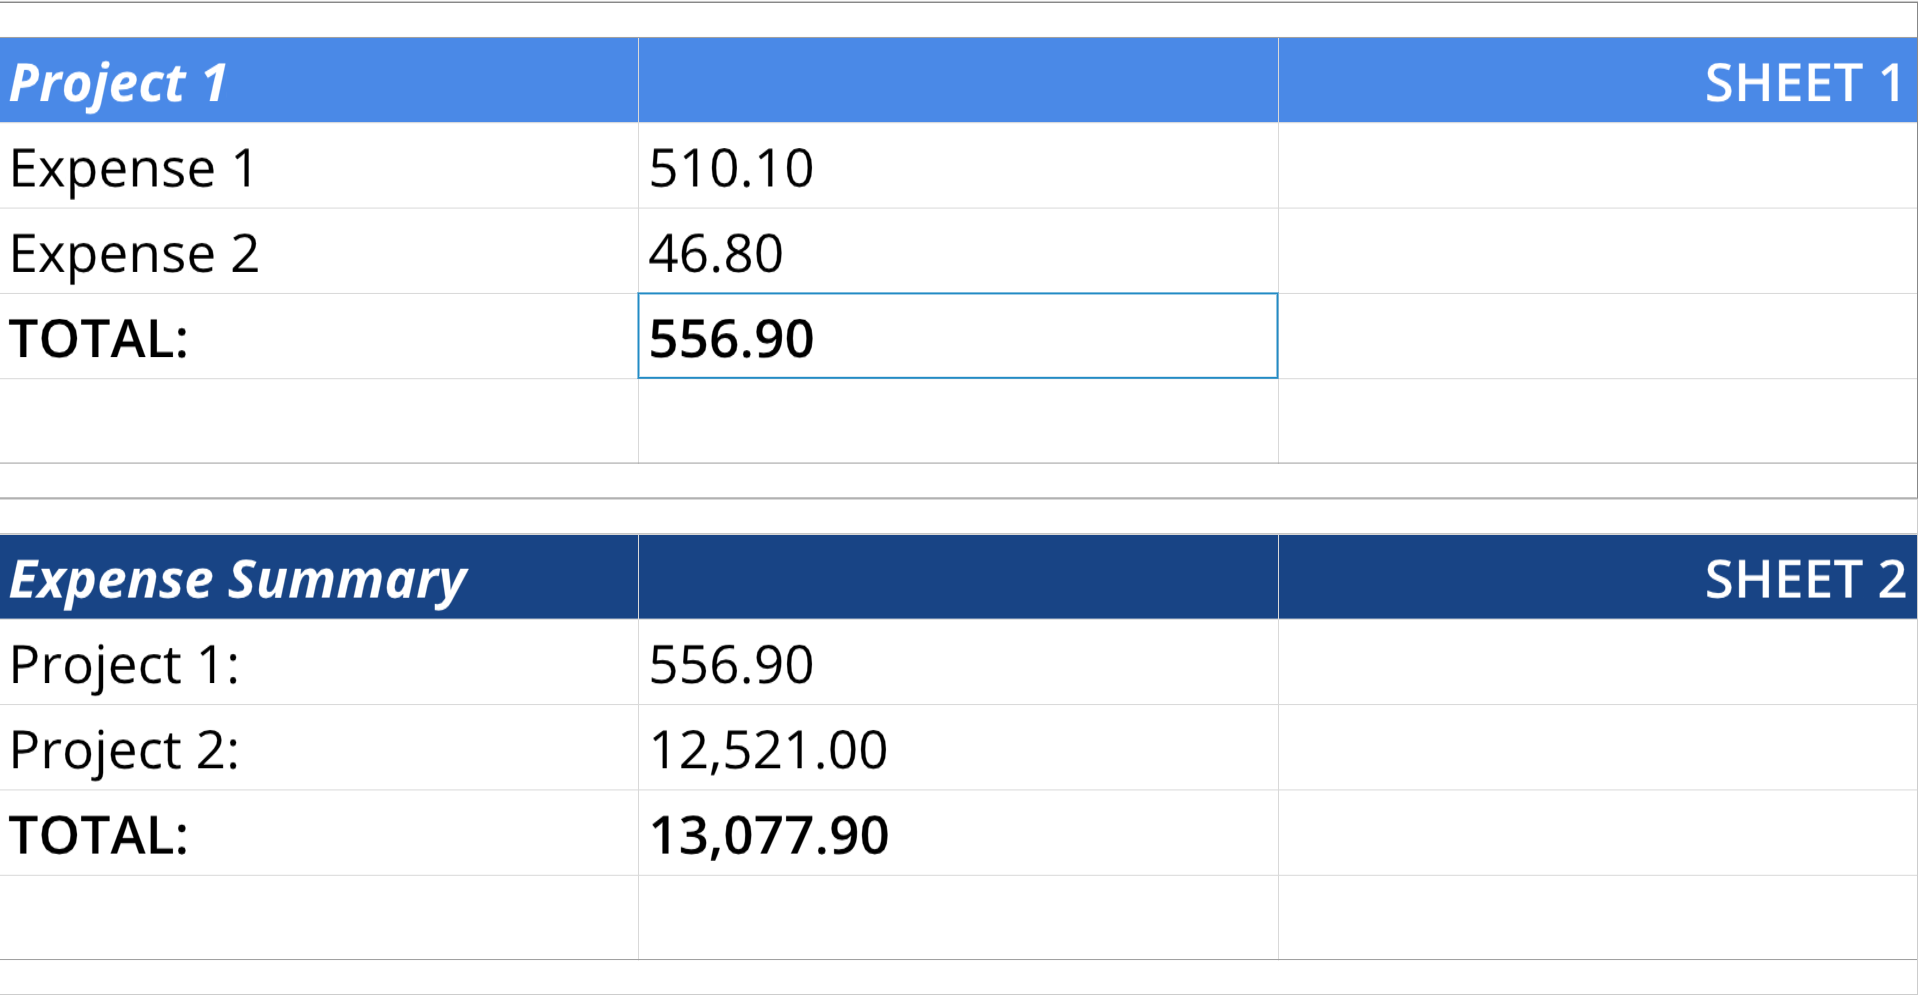
Multiple Spreadsheets
from row64tools.dash64 import dash64
dash = dash64("/var/www/dashboards/temp/linkss.dash")
pList = [
    ["Main",            "",             "1600",     "900",  "y"],
    ["TopPane",         "Main",         "*",        "*",    ""],
    ["BottomPane",      "Main",         "*",        "*",    ""]
]
dash.Layout.set_panes(pList)
ssDef = [
    ["A1",    "Project 1","BIC4a89e7OFFFFFF" ,"#,###.00"],
    ["B1",    None,"BC4a89e7"],
    ["C1",    "SHEET 1","H3BC4a89e7OFFFFFF"],
    ["A2",    "Expense 1"],
    ["B2",    "510.10"],
    ["A3",    "Expense 2"],
    ["B3",    "46.80",""],
    ["A4",    "TOTAL:","B"],
    ["B4",    "=SUM(B2:B3)","B","#,###.00"]
]
ssDim = [0, 0, 2, 4]
dash.add_spreadsheet("Sheet1",ssDim, ssDef,"TopPane")
ssDef2 = [
    ["A1",    "Expense Summary","BIC1844857OFFFFFF" ,"#,###.00"],
    ["B1",    None,"BC184485OFFFFFF"],
    ["C1",    "SHEET 2","H3BC184485OFFFFFF"],
    ["A2",    "Project 1:"],
    ["B2",    "=Sheet1!B4", "","#,###.00"],
    ["A3",    "Project 2:"],
    ["B3",    "12521", "","#,###.00","12,521.00"],
    ["A4",    "TOTAL:","B"],
    ["B4",    "=SUM(B2:B3)","B","#,###.00"]
]
ssDim2 = [0, 0, 2, 4]
dash.add_spreadsheet("Sheet2",ssDim2, ssDef2,"BottomPane")
dash.save()
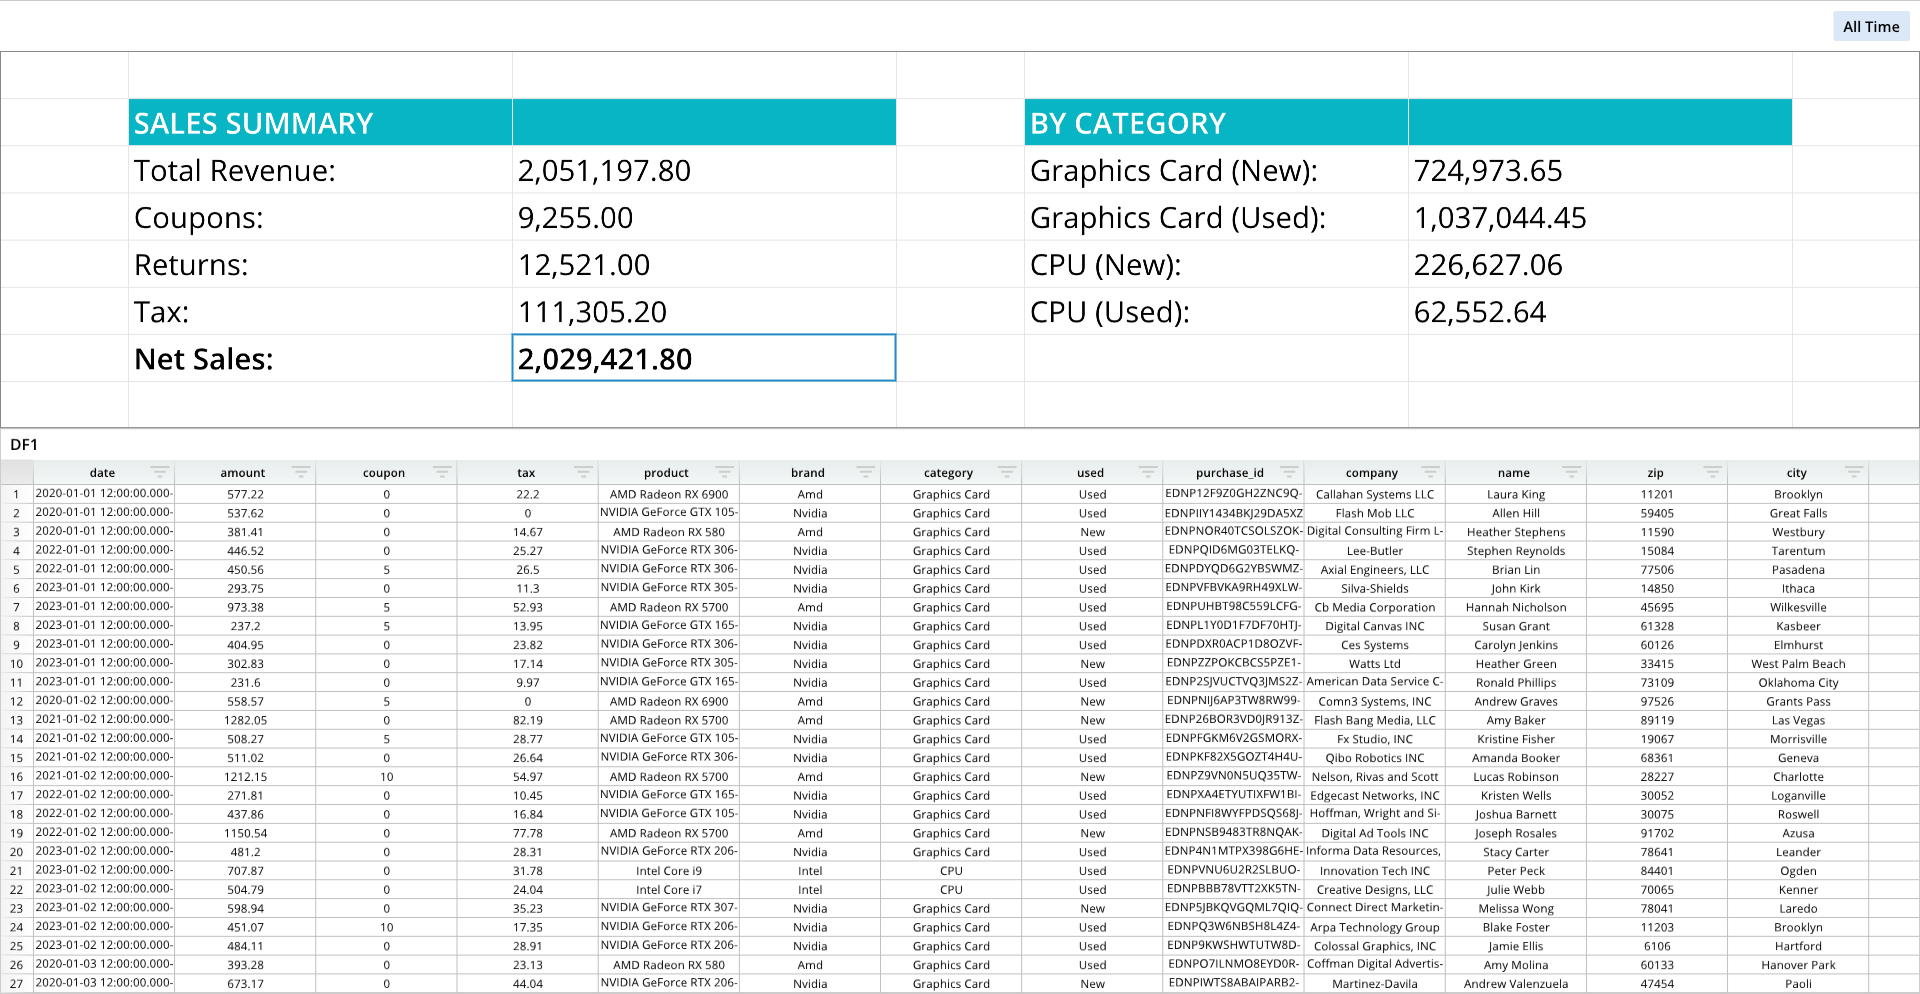
Spreadsheet Summary of a Dataframe
from row64tools.dash64 import dash64
dash = dash64("/var/www/dashboards/temp/dfss.dash")
pList = [
    ["Main",            "",             "1600",     "900",  "y"],
    ["TopPane",         "Main",         "*",        "40%",  ""],
    ["BottomPane",      "Main",         "*",        "60%",  ""]
]
dash.Layout.set_panes(pList)
dash.add_ramdb("/var/www/ramdb/live/RAMDB.Row64/Examples/HardwareSales.ramdb","DF1")
dash.add_df("DF1", "BottomPane")
ssDef = [
    ["B2","SALES SUMMARY","BC08b5c5OFFFFFF"],["C2","","BC08b5c5"],
    ["B3","Total Revenue:"],["C3","=SUM(DF1!B:B)","","#,###.00"],
    ["B4","Coupons:"],["C4","=SUM(DF1!C:C)","","#,###.00"],
    ["B5","Returns:"],["C5","12521", "","#,###.00","12,521.00"],
    ["B6","Tax:"],["C6","=SUM(DF1!D:D)","","#,###.00"],
    ["B7","Net Sales:","B"],["C7","=C3-C4-C5","B","#,###.00"],
    ["E2","BY CATEGORY","BC08b5c5OFFFFFF"],["F2","","BC08b5c5"],
    ["E3","Graphics Card (New):"],["F3","=SUMIFS(DF1!B:B,DF1!G:G,\"Graphics Card\",DF1!H:H,\"New\")","","#,###.00"],
    ["E4","Graphics Card (Used):"],["F4","=SUMIFS(DF1!B:B,DF1!G:G,\"Graphics Card\",DF1!H:H,\"Used\")","","#,###.00"],
    ["E5","CPU (New):"],["F5","=SUMIFS(DF1!B:B,DF1!G:G,\"CPU\",DF1!H:H,\"New\")","","#,###.00"],
    ["E6","CPU (Used):"],["F6","=SUMIFS(DF1!B:B,DF1!G:G,\"CPU\",DF1!H:H,\"Used\")","","#,###.00"]
]
ssDim = [0, 0, 6, 7]
dash.add_spreadsheet("Sheet1",ssDim, ssDef,"TopPane")
cWidths = dash.Sheets.Items[ dash.Sheets.get_sheet_ind("Sheet1") ].ColumnWidths
for i, w in zip([0,3,6],[50,50,50]):cWidths[i] = w # widen columns
paneDef = [["Layout","Fit", 2]] # 0 = no fit, 1 = fit to pane, 2 = stretch to pane
dash.set_pane_def( "TopPane", paneDef)
dash.save()
Pane Setup and Widgets
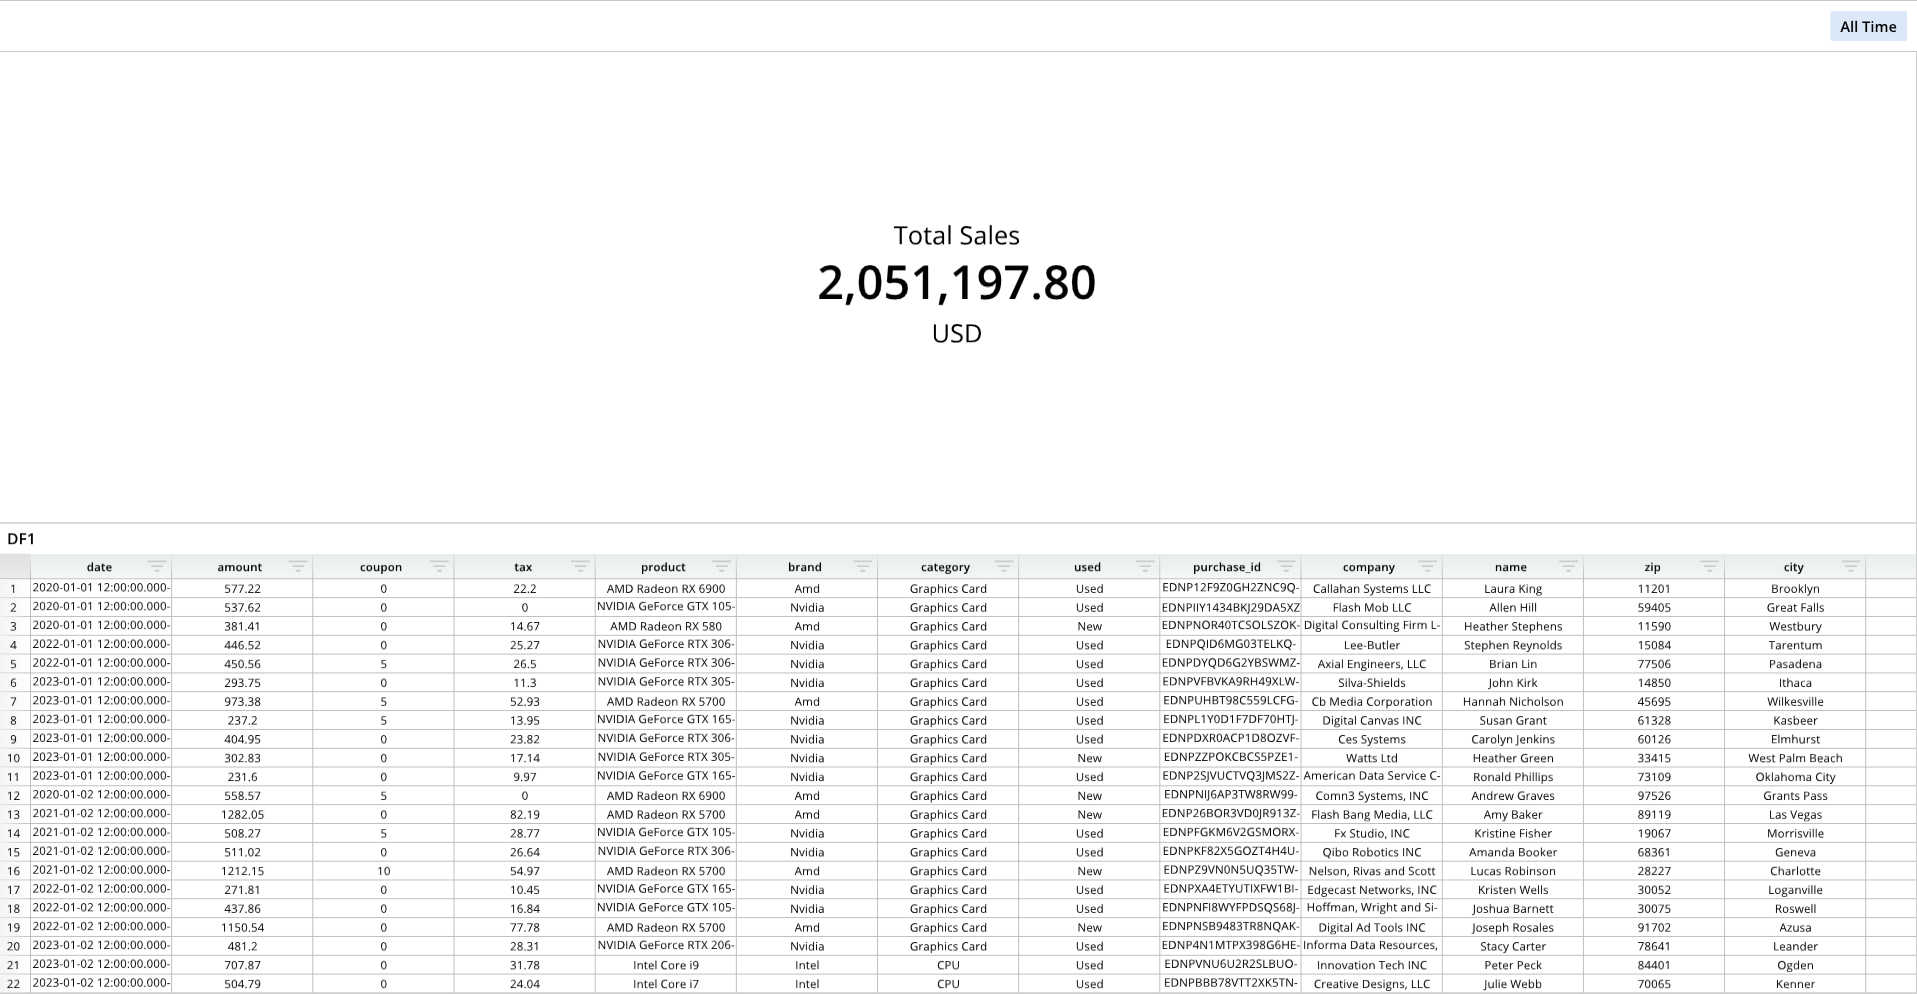
Pane Text and Equations
from row64tools.dash64 import dash64
dash = dash64("/var/www/dashboards/temp/panetext.dash")
pList = [
    ["Dashboard",       "",             "1600",     "900",  "y"],
    ["TopPane",         "Dashboard",    "*",        "*",    ""],
    ["BottomPane",      "Dashboard",    "*",        "50%",  ""]
]
dash.Layout.set_panes(pList)
dash.add_ramdb("/var/www/ramdb/live/RAMDB.Row64/Examples/HardwareSales.ramdb","DF1")
dash.add_df("DF1", "BottomPane")
paneDef = [
    ["Text","Total Sales","H2V2S26E12"],
    ["Equation", "=SUM(DF1!B:B)","BS48","#,##0.00"],
    ["Text2","USD","H2V2S26"]
]
dash.set_pane_def("TopPane",paneDef)
dash.save()
For information on text formatting, please see the Text Formatting page.
For information on number formatting, please see the Number Formatting page.
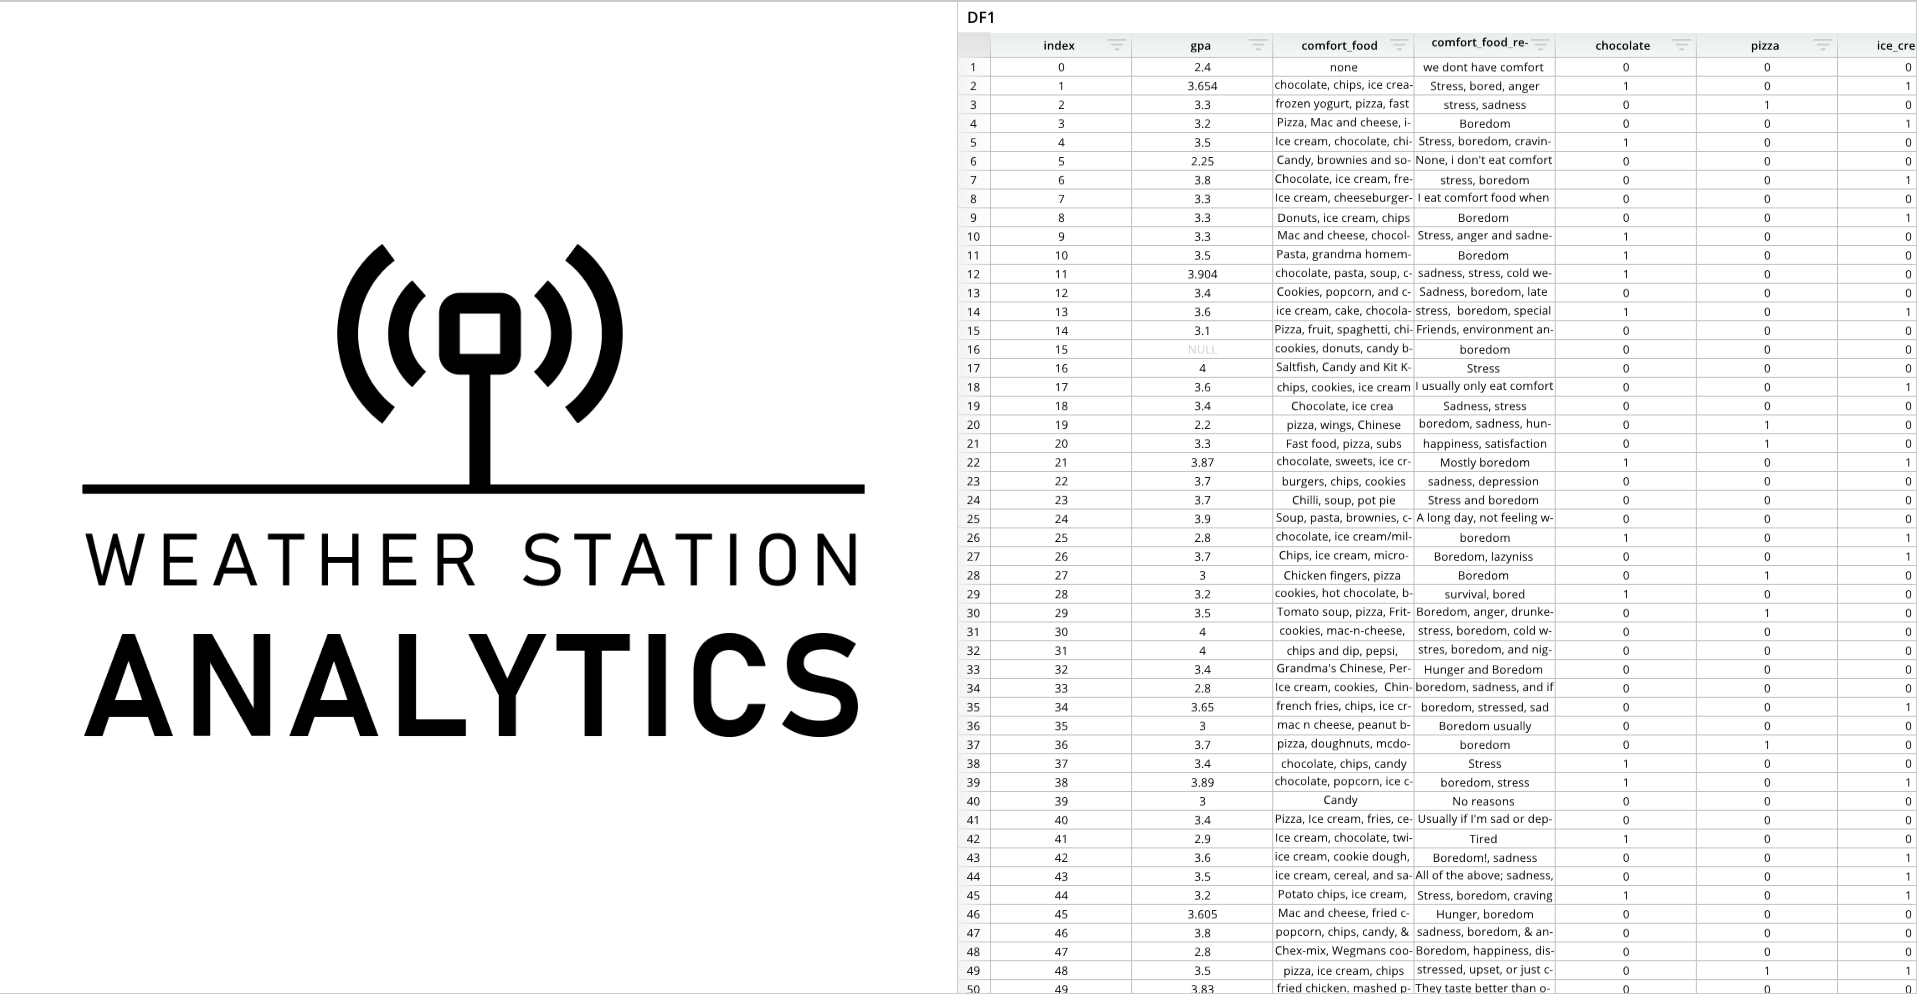
Pane Image
from row64tools.dash64 import dash64
import os
dash = dash64("/var/www/dashboards/temp/image.dash")
pList = [
    ["Dashboard",       "",             "1600",     "900",  "x"],
    ["Left",         "Dashboard",    "*",        "*",    ""],
    ["Right",      "Dashboard",    "*",        "50%",  ""]
]
dash.Layout.set_panes(pList)
dash.add_ramdb("/var/www/ramdb/live/RAMDB.Row64/Examples/FoodGPA.ramdb","DF1")
dash.add_df("DF1", "Right")
imgPath = os.path.join(dash.get_folder(), "Test_Logo.png")
imgDef = [
    ["Padding", .1],
    ["Link", "www.row64.com"]
]
dash.add_image("Left", imgPath, imgDef)
dash.save()
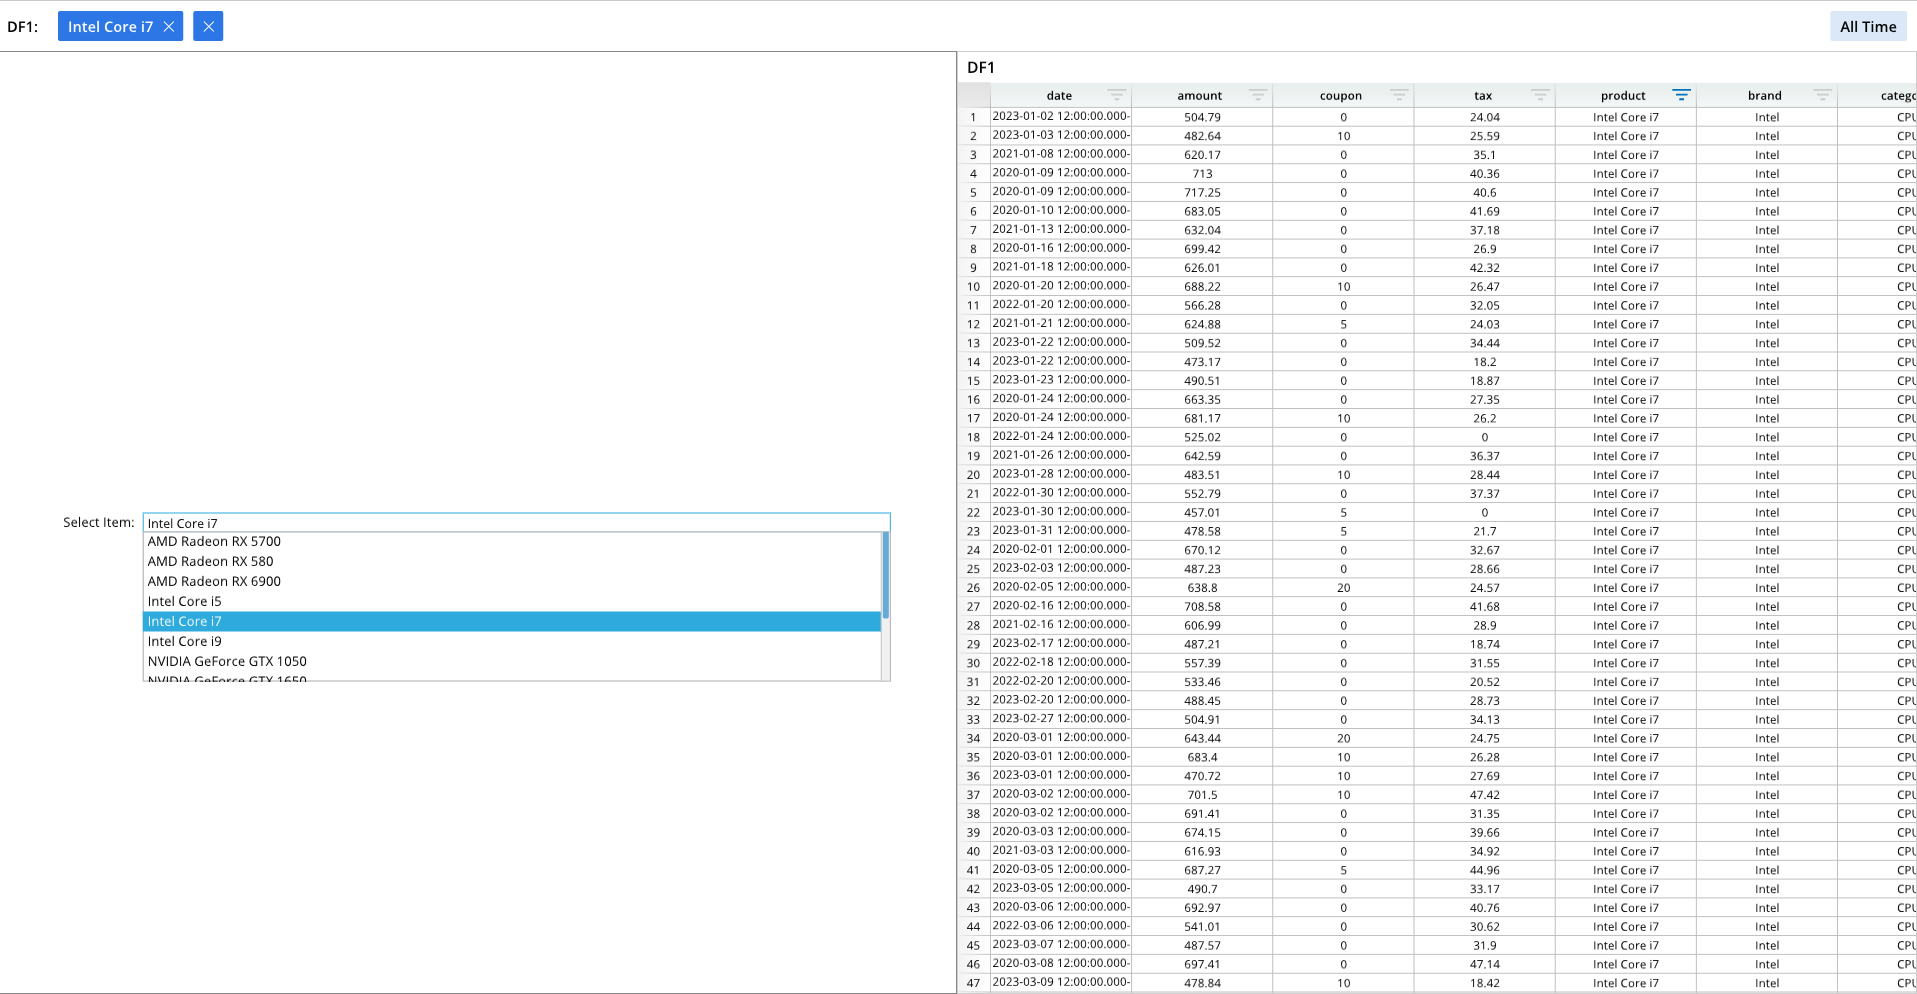
Combo Box
Combo Box
from row64tools.dash64 import dash64
dash = dash64("/var/www/dashboards/temp/combo.dash")
pList = [
    ["Dashboard",       "",             "1600",     "900",  "x"],
    ["Left",         "Dashboard",    "*",        "*",    ""],
    ["Right",      "Dashboard",    "*",        "50%",  ""]
]
dash.Layout.set_panes(pList)
dash.add_ramdb("/var/www/ramdb/live/RAMDB.Row64/Examples/HardwareSales.ramdb","DF1")
dash.add_df("DF1", "Right")
wOptions = [
    ["Label","Select Item:"],
    ["Column","=DF1!E:E"],
    ["Padding",0.23],
    ["Grid",[]]
]
dash.add_widget("Combo - Auto Filter", "Left", wOptions)
dash.save()
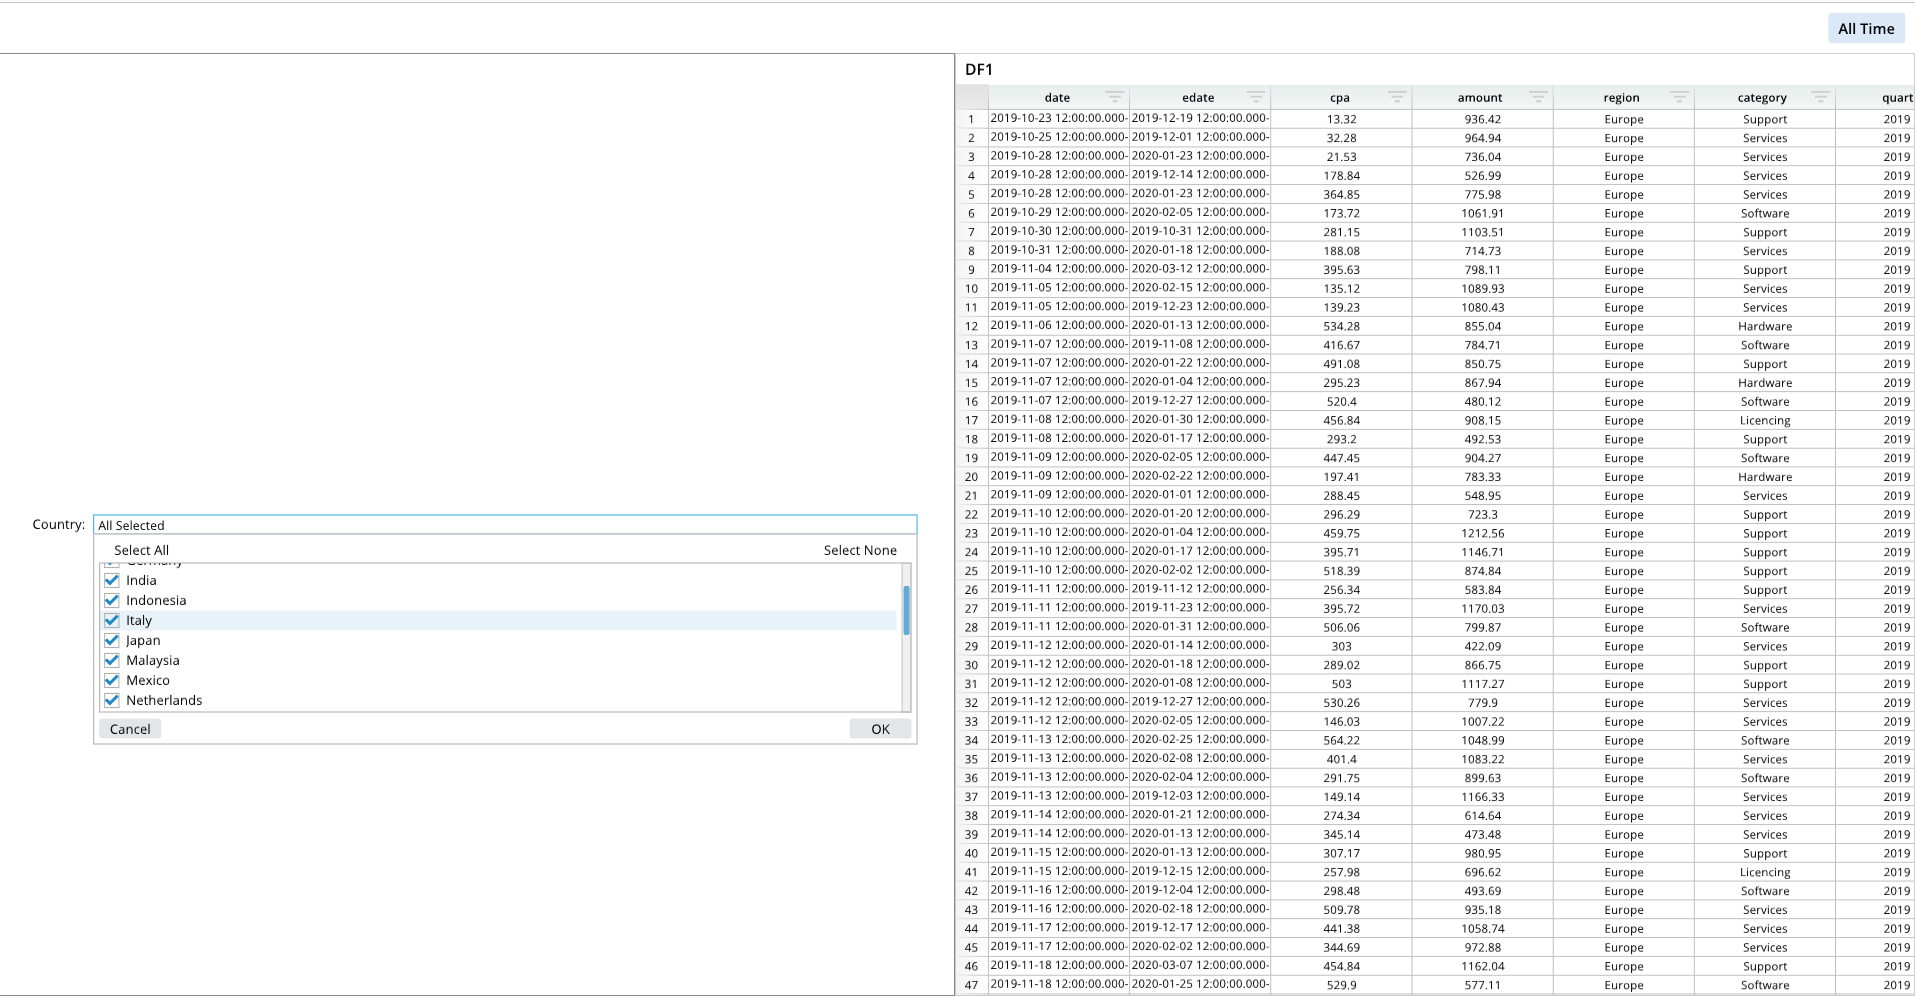
Combo Box with Check Marks
from row64tools.dash64 import dash64
dash = dash64("/var/www/dashboards/temp/checkcombo.dash")
pList = [
    ["Dashboard",       "",             "1600",     "900",  "x"],
    ["Left",         "Dashboard",    "*",        "*",    ""],
    ["Right",      "Dashboard",    "*",        "50%",  ""]
]
dash.Layout.set_panes(pList)
dash.add_ramdb("/var/www/ramdb/live/RAMDB.Row64/Examples/CostPerAcquisition.ramdb","DF1")
dash.add_df("DF1", "Right")
wOptions = [
    ["Label","Country:"],
    ["Column","=DF1!I:I"],
    ["Padding",0.13],
    ["Grid",[]]
]
dash.add_widget("Checkbox Combo - Auto Filter", "Left", wOptions)
dash.save()
Combo Box with Presets
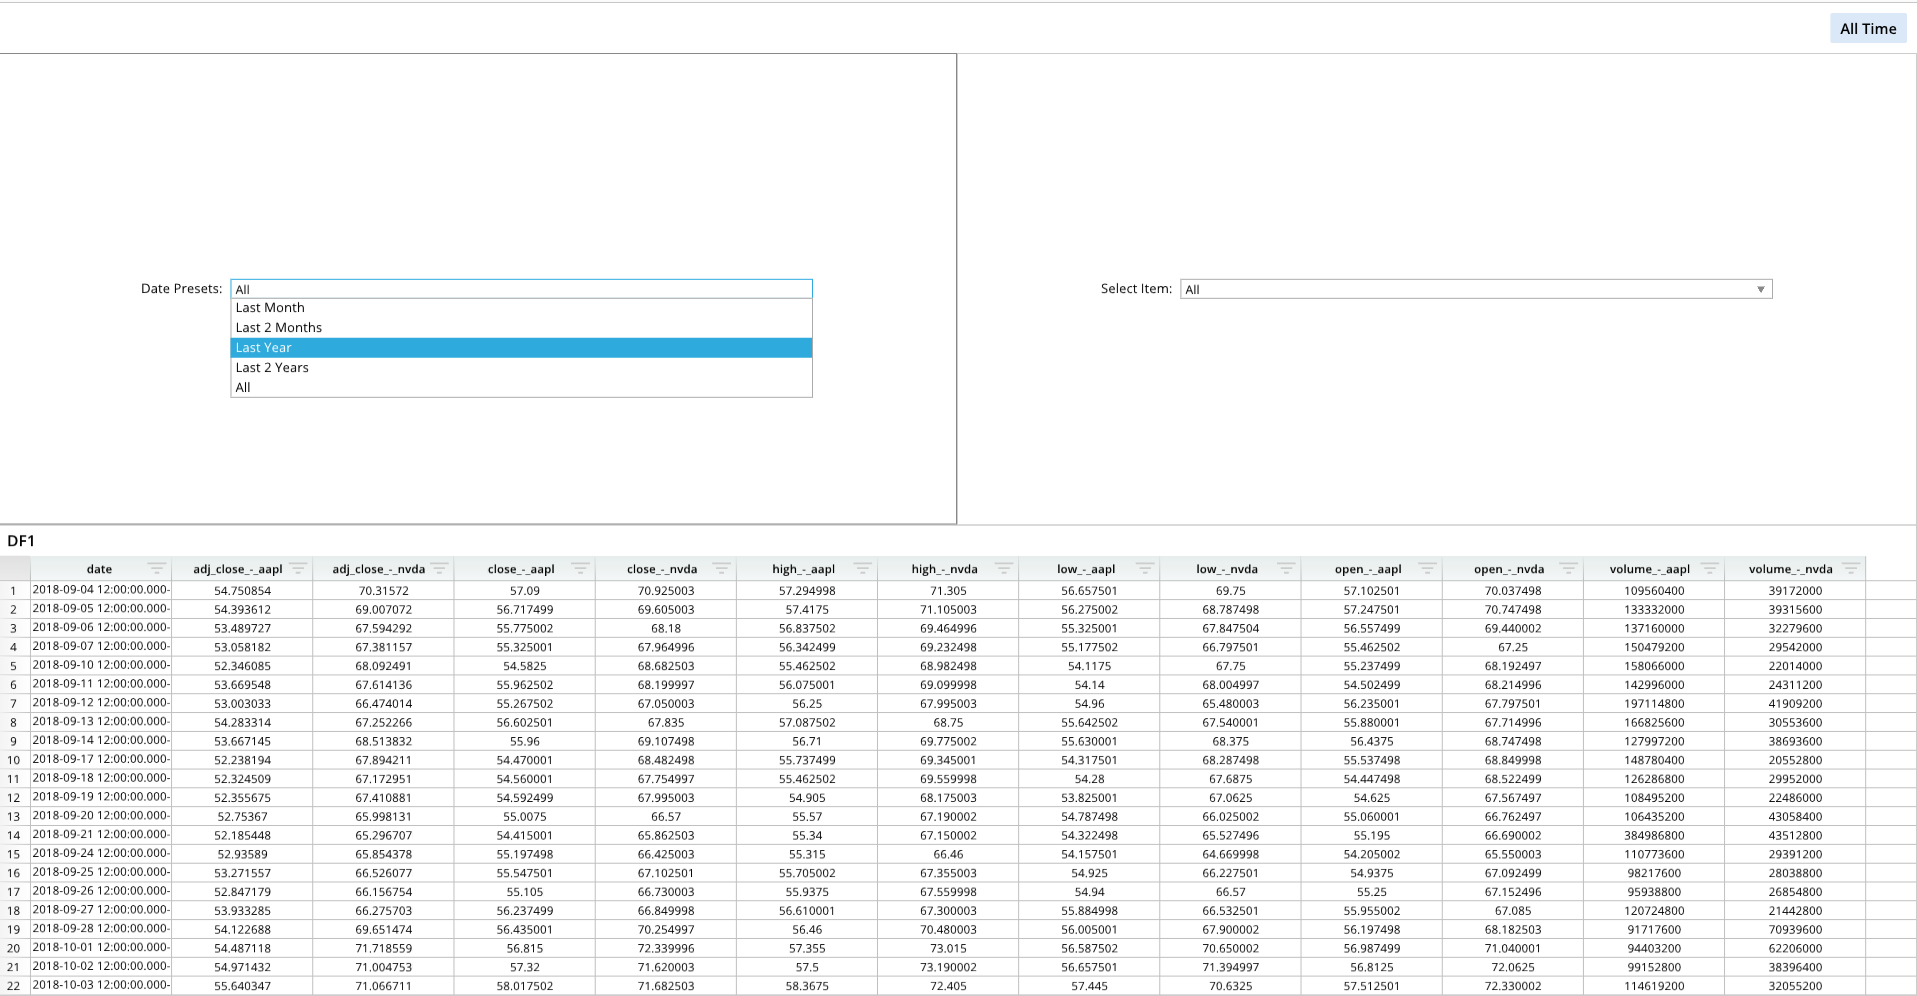
from row64tools.dash64 import dash64
dash = dash64("/var/www/dashboards/temp/presets.dash")
pList = [
    ["Dashboard",       "",             "1600",     "900",  "y"],
    ["Top",         "Dashboard",    "*",        "*",    "x"],
    ["Bottom",      "Dashboard",    "*",        "50%",  ""],
    ["Left",       "Top",    "*",        "*",    ""],
    ["Right",      "Top",    "*",        "50%",  ""]
]
dash.Layout.set_panes(pList)
dash.add_ramdb("/var/www/ramdb/live/RAMDB.Row64/Examples/MultipleStocks.ramdb","DF1")
dash.add_df("DF1", "Bottom")
wOptions1 = [
    ["Label","Date Presets:"],
    ["Column","=DF1!A:A"],
    ["Padding",0.5],
    ["Grid",[
            [ "Last Month", "=EDATE(TODAY(),-1)", "=TODAY()" ],
            [ "Last 2 Months", "=EDATE(TODAY(),-2)", "=TODAY()" ],
            [ "Last Year", "=EDATE(TODAY(),-12)", "=TODAY()" ],
            [ "Last 2 Years", "=EDATE(TODAY(),-24)", "=TODAY()" ]
        ]
    ]
]
dash.add_widget("Date Presets", "Left", wOptions1)
wOptions2 = [
    ["Label","Select Item:"],
    ["Column","=DF1!B:B"],
    ["Padding",0.5],
    ["Grid",[
            ["AAPL Between 50 And 100", "50", "100" ],
            [ "AAPL More Than 55", "55", "" ]
        ]
    ]
]
dash.add_widget("Combo - Value Ranges", "Right", wOptions2)
dash.save()
Date Range
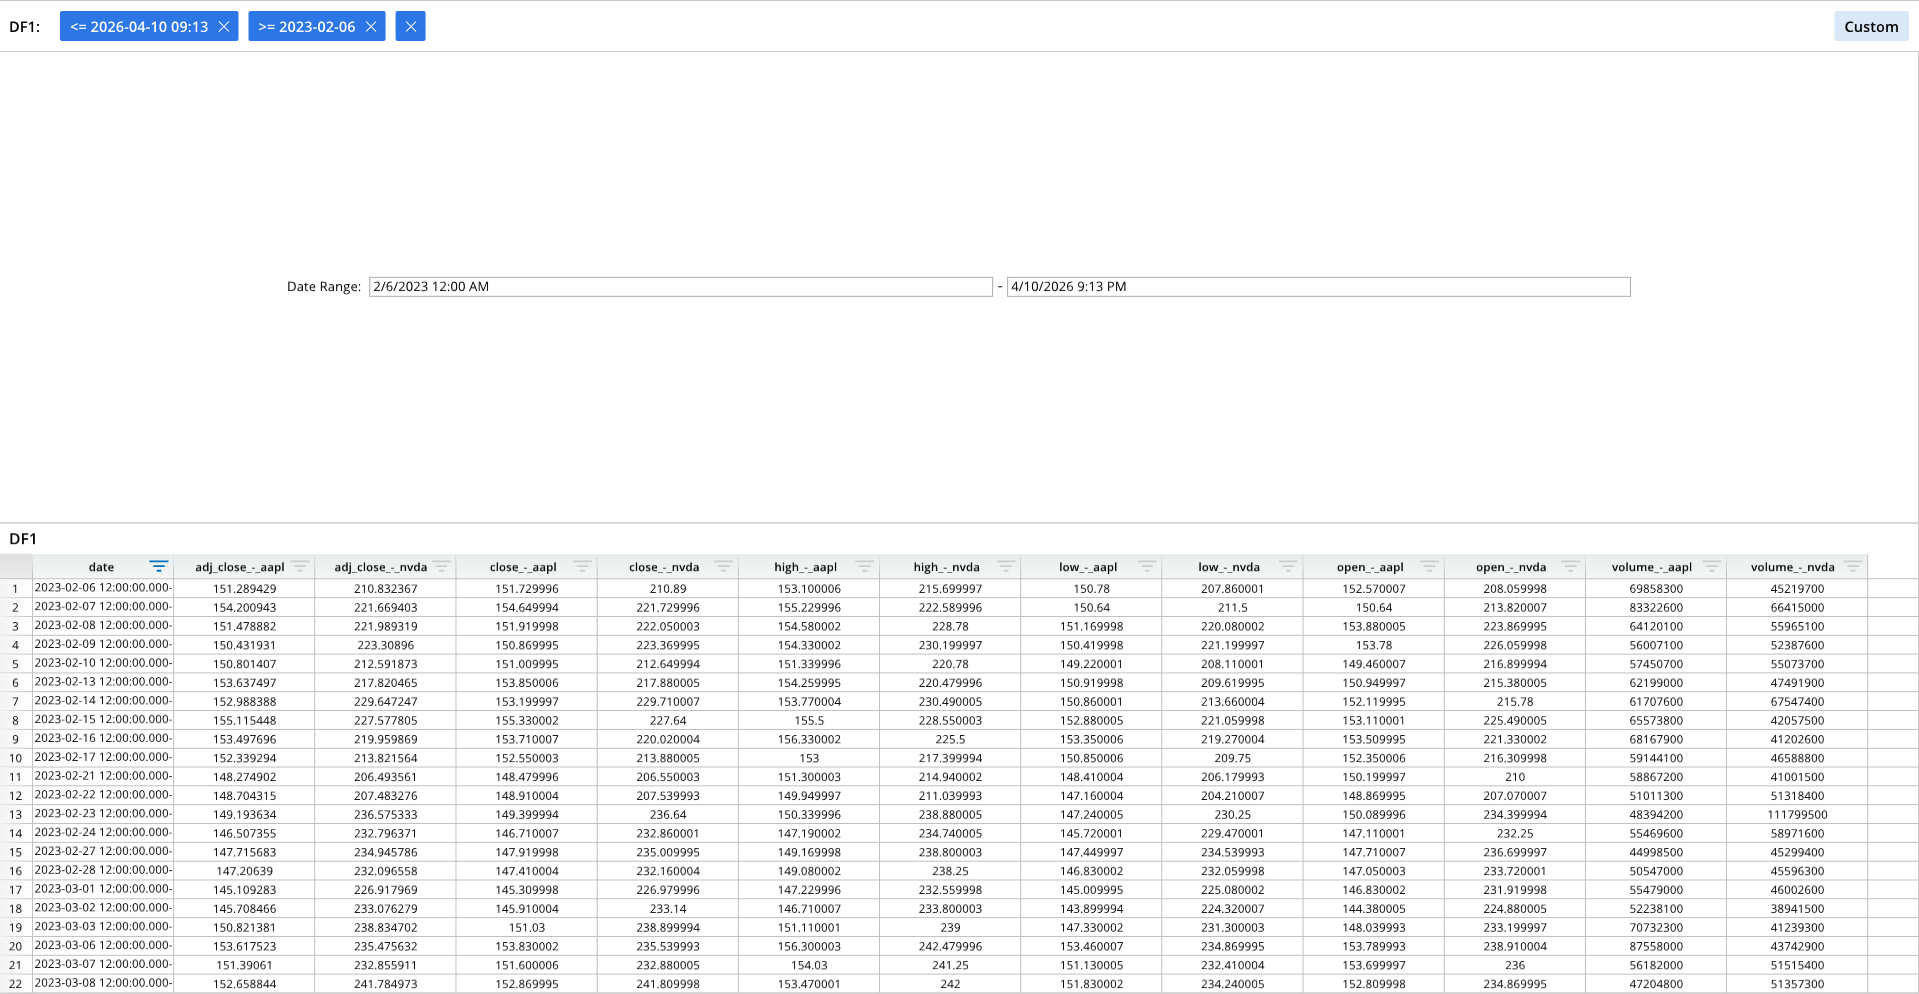
from row64tools.dash64 import dash64
dash = dash64("/var/www/dashboards/temp/drange.dash")
pList = [
    ["Dashboard",       "",             "1600",     "900",  "y"],
    ["Top",         "Dashboard",    "*",        "*",    ""],
    ["Bottom",      "Dashboard",    "*",        "50%",  ""]
]
dash.Layout.set_panes(pList)
dash.add_ramdb("/var/www/ramdb/live/RAMDB.Row64/Examples/MultipleStocks.ramdb","DF1")
dash.add_df("DF1", "Bottom")
wOptions1 = [
    ["Label","Date Range:"],
    ["Column","=DF1!A:A"],
    ["Padding",0.5],
    ["Grid",[
            [ "2/6/2023 12:00 AM" ],
            [ "=NOW()" ]
        ]
    ]
]
dash.add_widget("Date & Time Range", "Top", wOptions1)
dash.save()
Slider and Equation Formatting
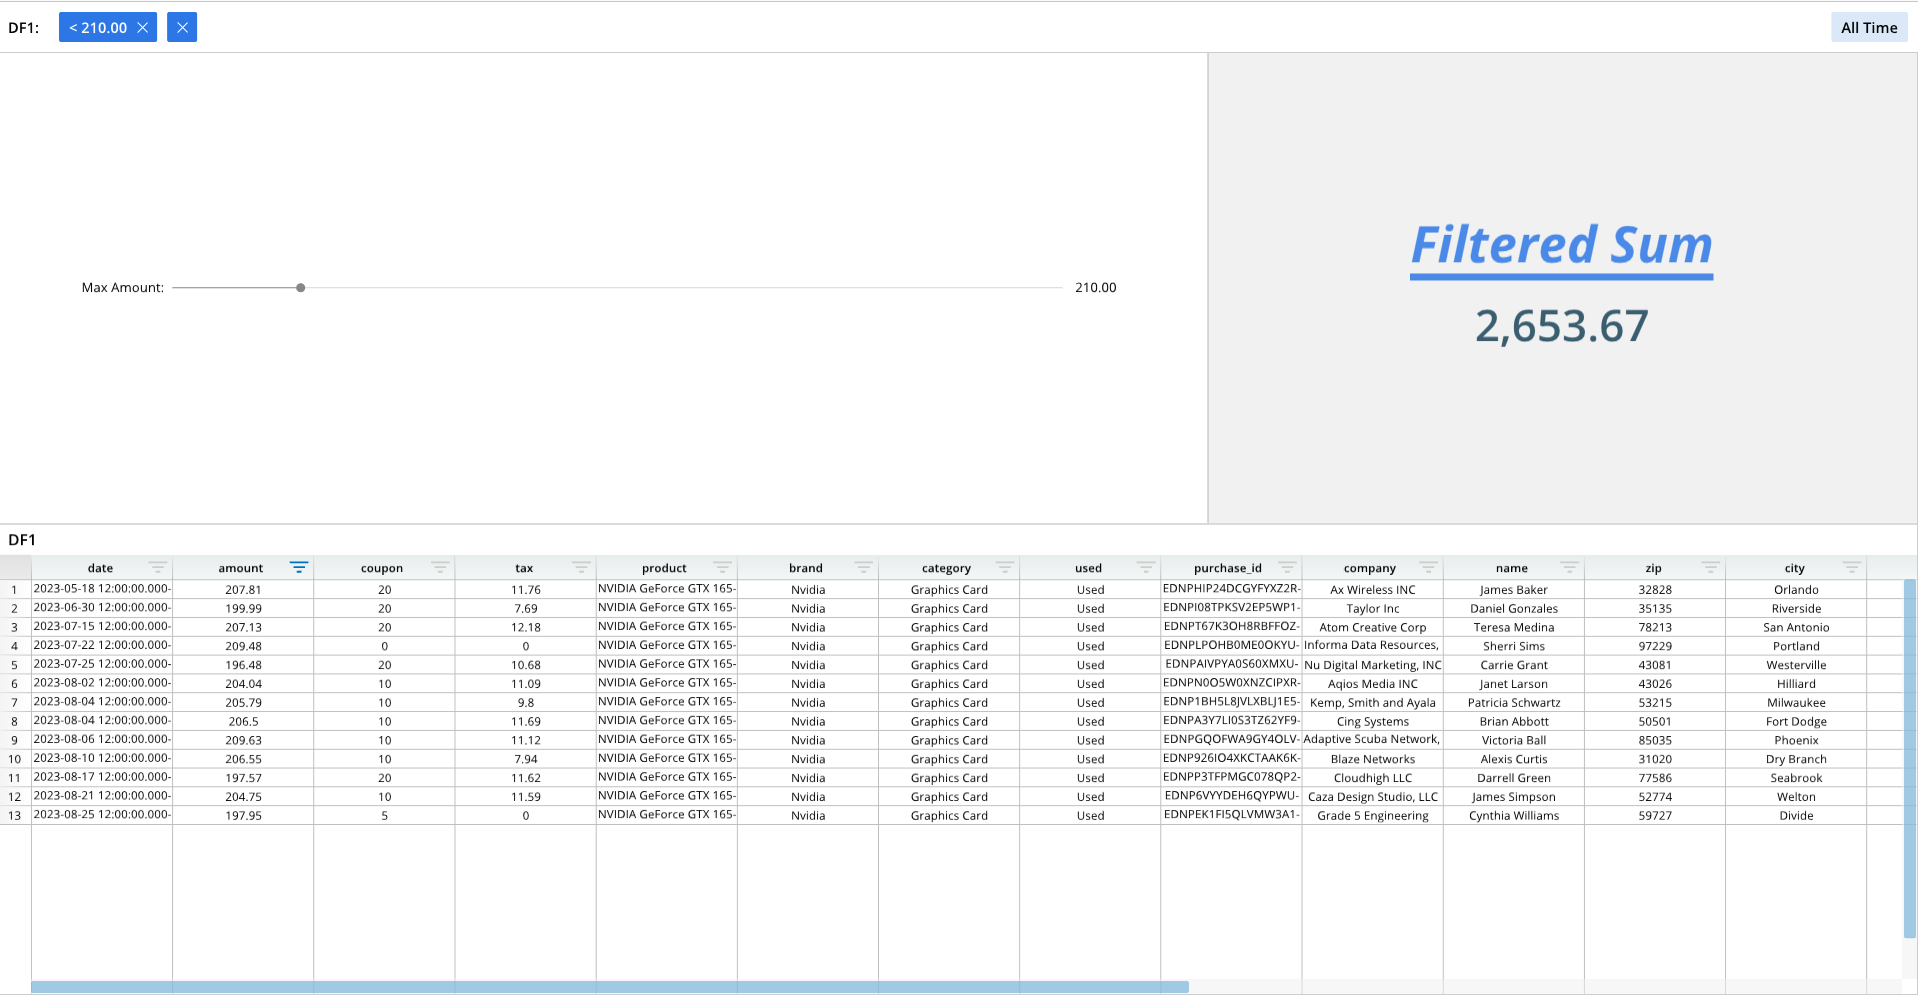
from row64tools.dash64 import dash64
dash = dash64("/var/www/dashboards/temp/slider.dash")
pList = [
    ["Dashboard",       "",     "1600",     "900",  "y"],
    ["TopPane",     "Dashboard",    "*",        "*",    "x"],
    ["BottomPane",      "Dashboard",    "*",        "*",    ""],
    ["LeftPane",        "TopPane",  "63%",      "*",    ""],
    ["RightPane",       "TopPane",  "37%",      "*",    ""]
]
dash.Layout.set_panes(pList)
dash.add_ramdb("/var/www/ramdb/live/RAMDB.Row64/Examples/HardwareSales.ramdb","DF1")
dash.add_df("DF1", "BottomPane")
# For slider Action Option Index:
# 0 = Less Than Slider Value, 1 = Greater than Slider Value, 2 = Equal To Slider Value
wOptions = [
    ["Label","Max Amount:"],
    ["Column","=DF1!B:B"],
    ["Padding",0.23],
    ["Grid",[["0"],["210"],["0"],["1500"]]] # Action Option Index, Default, Min, Max
]
dash.add_widget("Slider", "LeftPane", wOptions)
fontDef = [
    ["FontSize",52],
    ["VerticalSpace",32],
    ["Bold"],
    ["Italic"],
    ["Underline"],
    ["Align",.5],
    ["Color",0x4a89e7]
]
eqDef = [
    ["FontSize",45],
    ["Bold"],
    ["Color",0x3a5e70],
    ["Format","#,##0.00"]
]
paneDef = [
    ["Color",0xF1F1F1],
    ["Text",dash.format_text("Filtered Sum",fontDef)],
    ["Equation",dash.format_equation("=SUM(DF1!B:B)",eqDef)]
]
dash.add_to_pane("RightPane", paneDef)
dash.save()
Log and Debug
Log Panes
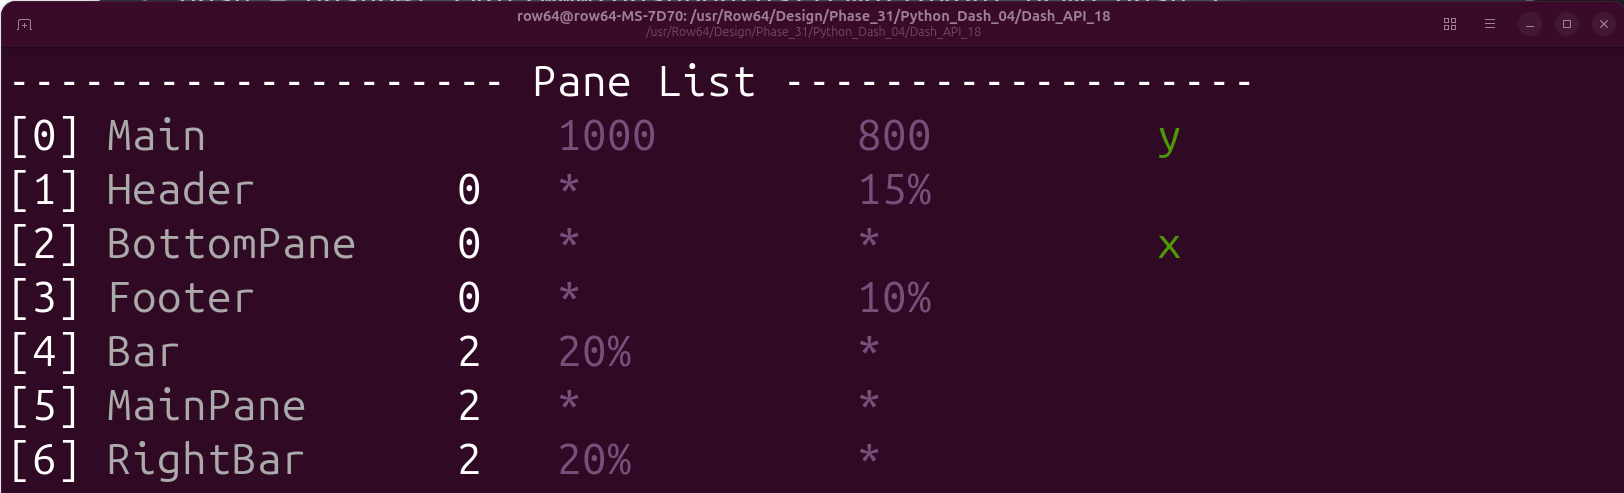
from dash64 import dash64
dash = dash64("/var/www/dashboards/temp/layout_demo.dash")
pList = [
    ["Main",                "",                 "1000",         "800",      "y"],
    ["Header",              "Main",             "*",            "15%",      "" ],
    ["BottomPane",          "Main",             "*",            "*",        "x"],
    ["Footer",              "Main",             "*",            "10%",      "" ],
    ["Bar",                 "BottomPane",       "20%",          "*",        "" ],
    ["MainPane",            "BottomPane",       "*",            "*",        "" ],
    ["RightBar",            "BottomPane",       "20%",          "*",        "" ]
]
dash.Layout.set_panes(pList)
dash.Layout.log_panes()
Log Global Graph
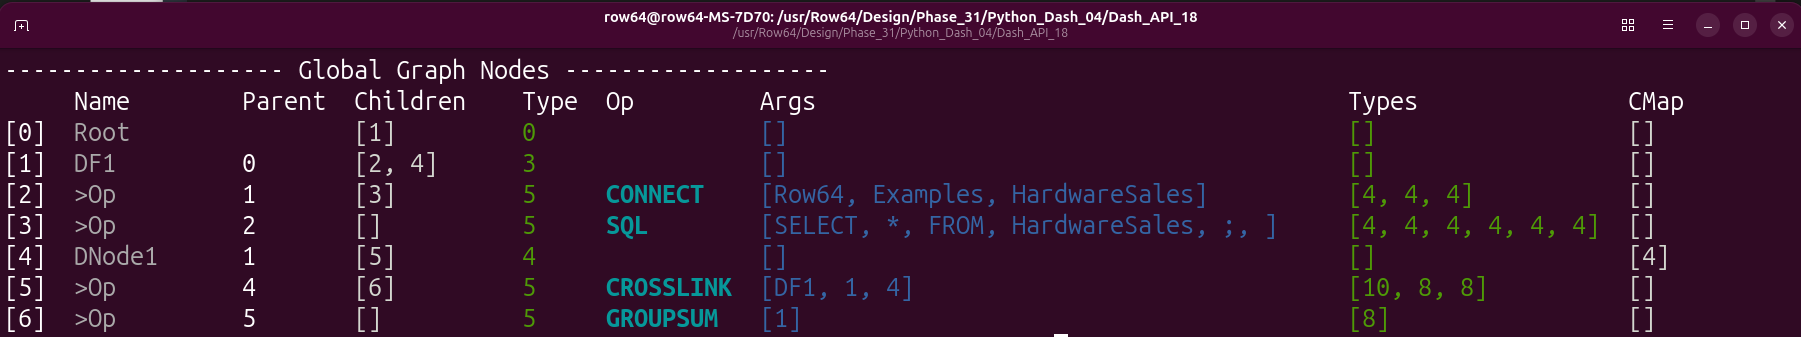
from dash64 import dash64
dash = dash64("/var/www/dashboards/temp/bar.dash")
pList = [
    ["Dashboard",       "",             "1600",     "900",  "y"],
    ["TopPane",         "Dashboard",    "*",        "*",    ""],
    ["BottomPane",      "Dashboard",    "*",        "50%",  ""]
]
dash.Layout.set_panes(pList)
dash.add_ramdb("/var/www/ramdb/live/RAMDB.Row64/Examples/HardwareSales.ramdb","DF1")
dash.add_df("DF1", "BottomPane")
dnDef = [[ "CROSSLINK", ["DF1",1,4], ["df","col","col"] ],
         [ "GROUPSUM",  [1],         ["col"]            ]]
dash.add_datanode("DNode1", "DF1", dnDef)
dash.Graph.log()
Log Spreadsheet
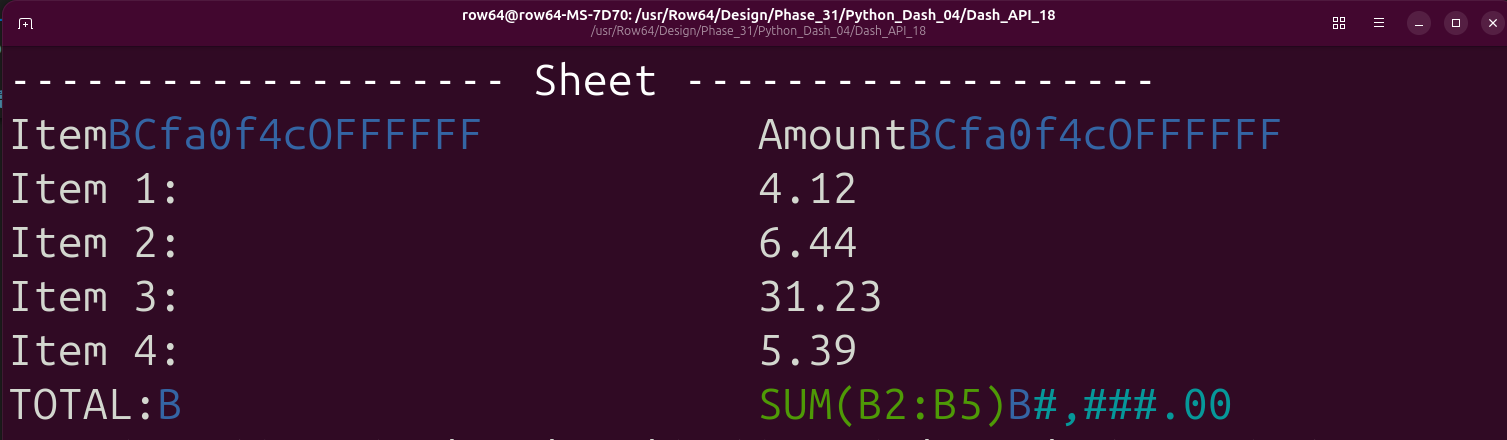
from dash64 import dash64
dash = dash64("/var/www/dashboards/temp/ssheet.dash")
pList = [
    ["Main",            "",             "1600",     "900",  "y"],
    ["TopPane",         "Main",         "*",        "20%",  ""],
    ["MidPane",         "Main",         "*",        "*",    ""],
    ["BottomPane",      "Main",         "*",        "20%",  ""]
]
dash.Layout.set_panes(pList)
ssDef = [
["A1","Item","BCfa0f4cOFFFFFF"],["B1","Amount","BCfa0f4cOFFFFFF"],
    ["A2","Item 1:"],["B2",    "4.12"],
        ["A3","Item 2:"],["B3",    "6.44"],
        ["A4","Item 3:"],["B4",    "31.23"],
        ["A5","Item 4:"],["B5",    "5.39"],
        ["A6","TOTAL:","B"],["B6", "=SUM(B2:B5)","B","#,###.00"],
]
dim = [0, 0, 1, 5]
dash.add_spreadsheet("Sheet1", dim, ssDef, "MidPane")
dash.DAG.log("Sheet1")
dash.save()