Data Nodes
Data nodes, which are based on dataframes, can be added to dashboard panes. To add a data node, a dataframe must first be established. Adding a data node requires the following components:
dnDef = []- The dnDef ("data node definition") component is a list that selects the included data from the dataframe.
dash.add_datanode("DNode1", "DF1", dnDef)- Creates the data node object. This function takes three arguments: the name of the data node, the identifier of the underlying dataframe, and the data node definition list.
"DNode1": The data node's name. In this example, a data node is given the name DNode1."DF1": The dataframe's tag, which acts as an alias for the loaded dataframe. Dataframes are referenced by their tags.dnDef: The data node definition list, whcih defines which data from the dataframe to include on the data node.
- Creates the data node object. This function takes three arguments: the name of the data node, the identifier of the underlying dataframe, and the data node definition list.
paneDef = []- The paneDef ("pane definition") component is a list that formats the layout of the data node. All layout options are listed on the Dataframe Options page.
dash.add_df("DNode1", "TopPane", paneDef)- Adds the data node to the dashboard. To add the data node to the dashboard, the data node's name, the targeted pain, and the pane definition list must be provided.
"DNode1": The name of the data node to add to the dashboard."TopPane": The name of the pane on which the data node should be added.paneDef: The pane definition list, which defines the data node's formatting.
- Adds the data node to the dashboard. To add the data node to the dashboard, the data node's name, the targeted pain, and the pane definition list must be provided.
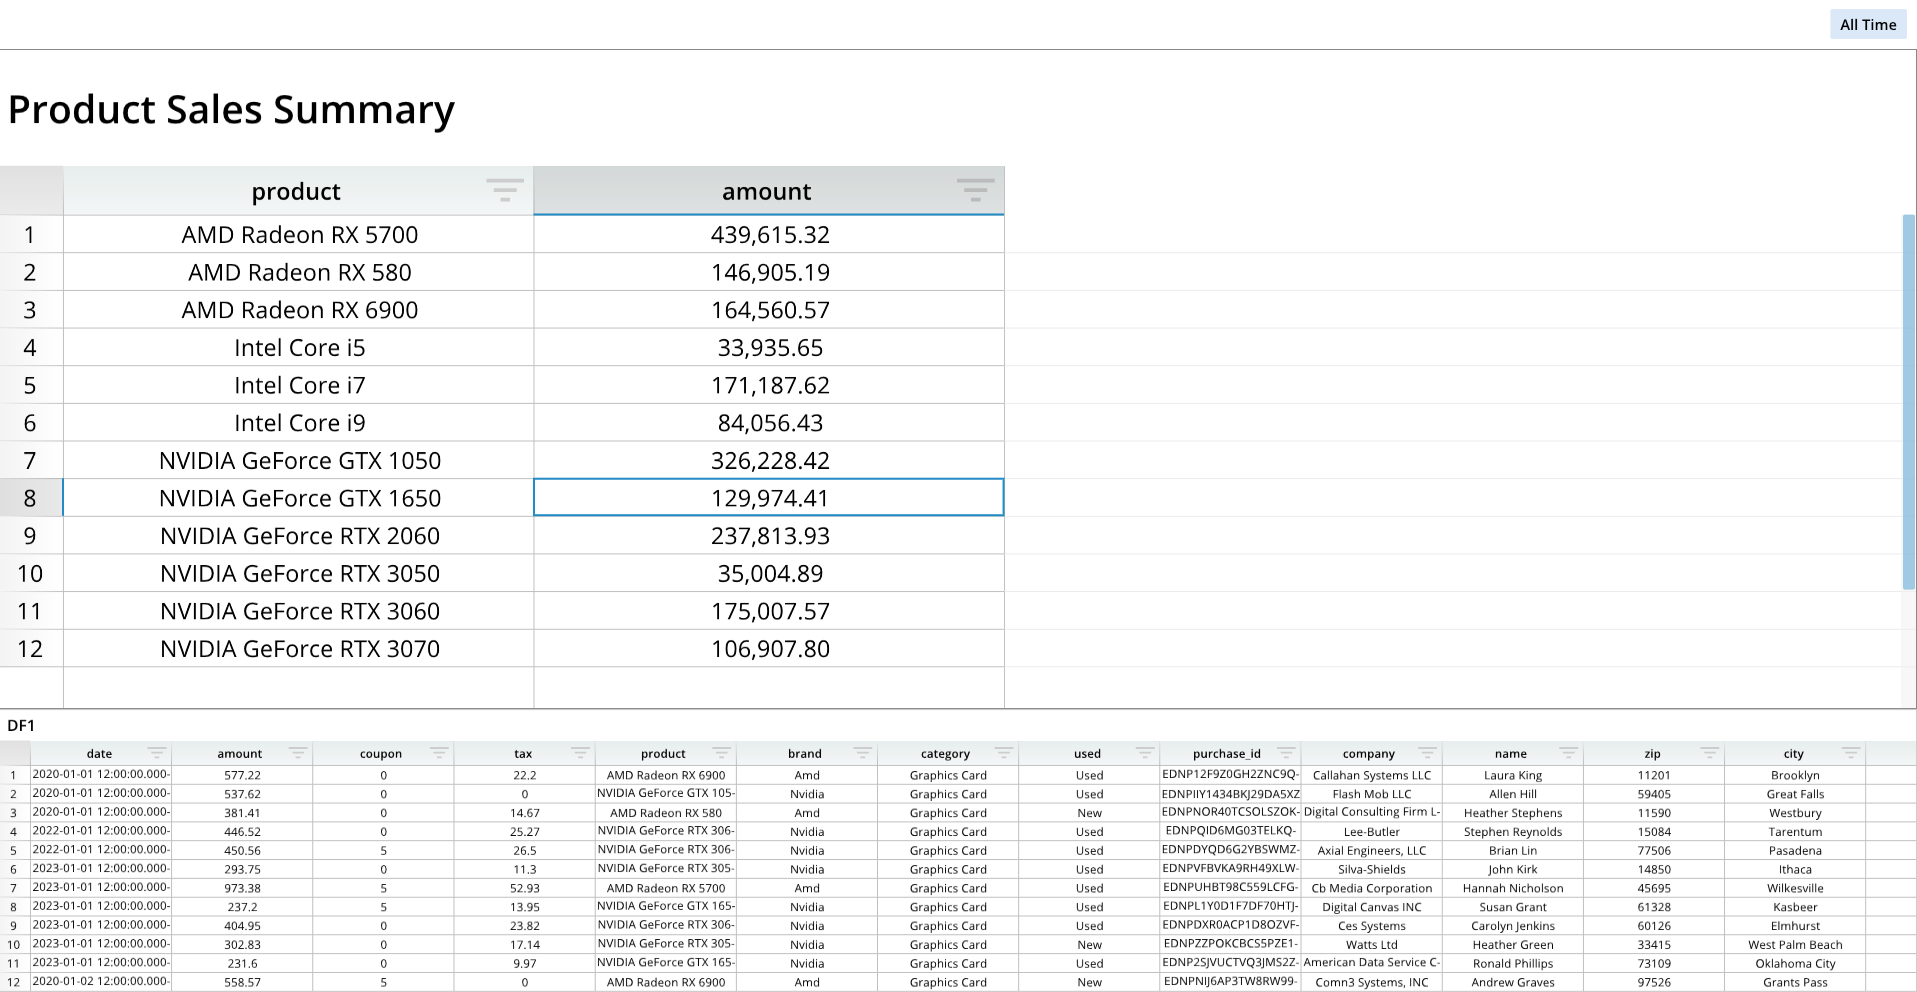
The following example generates a new dashboard, adds a dataframe, and adds a data node based on the dataframe:
from row64tools.dash64 import dash64
dash = dash64("/var/www/dashboards/temp/dnode.dash")
pList = [
    ["Dashboard",       "",             "1600",     "900",  "y"],
    ["TopPane",         "Dashboard",    "*",        "*",    ""],
    ["BottomPane",      "Dashboard",    "*",        "30%",  ""]
]
dash.Layout.set_panes(pList)
dash.add_ramdb("/var/www/ramdb/live/RAMDB.Row64/Examples/HardwareSales.ramdb","DF1")
dash.add_df("DF1", "BottomPane")
dnDef = [[ "CROSSLINK", ["DF1",1,4], ["df","col","col"] ],
         [ "GROUPSUM",  [1],         ["col"]            ]]
dash.add_datanode("DNode1", "DF1", dnDef)
paneDef = [
    ["Layout","Zoom",2.0],
    ["Layout","Title","Product Sales Summary"],
    ["Layout","TitleFont","Bold",True],
    ["Column", 0, "Width", 250],
    ["Column", 1, "Code", "#,###.00"],
    ["Column", 1, "Width", 250]
]
dash.add_df("DNode1", "TopPane", paneDef)
dash.save()