Geo
The DashAPI can deploy dashboards with maps that use coordinates, markers, or shape attributes.
Geo with coordinate points
Geo with markers
Geo with shape attributes
Required Components
Adding a geo diagram with coordinates or markers requires the following components:
gShapes = []- A list that defines the properties of the map. In this list, you can designate the file path for .geo files, establish and name shape layers, and visually format shape layers.
gCoords = []- A list that defines the properties of the map's coordinates. This list associates coordinates to a dataframe or data node, and formats the visual appearance of the coordinate points or markers.
- Whether a map uses coordinate points or markers is determined in the
gCoordslist with theSpritePathformat option.- For coordinate points, do not specify a sprite path.
- Example:
["SpritePath", ""]
- Example:
- For markers, specify a sprite path, which can be a file path or a preset name.
- Example:
["SpritePath", "Star_Blue"]
- Example:
- For coordinate points, do not specify a sprite path.
- For a geo with shape attributes, do not specify a
gCoordslist, since these types of maps do not use coordinate points or markers.- Instead of specyfing coordinate points or markers in the
gCoordslist, the coloring of a geo with shape attributes is defined in thegShapeslist with theColorValuesshape layer format option.
- Instead of specyfing coordinate points or markers in the
gDef = []- A list that sets the projection mode and camera view, which is the initial view of the map.
- For example, if you have a .geo map of the full world, but want the dashboard to focus only on North America, you would set the camera view on North America, rather than displaying all countries in the world. This way, when the dashboard loads, the map focuses on North America.
- A list that sets the projection mode and camera view, which is the initial view of the map.
dash.add_geo()- A function that places the map on a dashboard pane. This function takes the map's name, the targeted pane name, and the shapes, coordinate, and definition lists as arguments.
Components Syntax
gShapes
gShapes = [
    [
        ["File",os.path.join(dash.get_folder(), "us_states_lines.geo")],
        ["Name","State Borders"],
        ["Color",0x444444],
        ...
    ],
    ...
]
The gShapes list defines the shape layer properties of the map, which includes the .geo file locations and shape layer formatting. Each formatting option is encapsulated in brackets [ ], and options are grouped together per .geo within another set of brackets. Individual list items, as well as list groups, are separated by commas.
For a full code example that displays multiple gShapes list items, please refer to the Code Example section below. To see all available shape layer geo options, please refer to the Shape Layer Options section.
gCoords
gCoords = [
    [
        ["Name", "Hardware Sales"],
        ["Lat","=DF1!O:O"],
        ["Lon","=DF1!P:P"],
        ...
    ]
]
The gCoords list formats the shape layer (coord layer) and establishes the layer's name, links coordinates to a dataframe, and visually formats markers. List items are encapsulated in brackets [ ] and separated by commas.
For a geo with shape attributes, do not include the gCoords list, since these maps do not use coordinate points or markers.
For a full code example, please refer to the Code Example section below. To see all available coordinate layer geo options, please refer to the Coord Layer Options section.
gDef
gDef = [
    ["ProjectionMode",1],
    ["ViewRects",[[15000.000000, 31567.729362, 31666.666667, 41085.522538]]],
    ["ViewNames", ["US Mainland"]],
    ...
]
The gDef list is for geo options, which establishes the projection mode and camera view. List items are encapsulated in brackets [ ] and separated by commas.
For a full code example, please refer to the Code Example section below. To see all available geo options, please refer to the Geo Options section.
dash.add_geo()
dash.add_geo("GEO_NAME","PANE_NAME", gDef, gShapes, gCoords)
The dash.add_geo() function adds the map to a designated dashboard pane. This function takes the chart's name, the destination pane's name, and the options lists as arguments.
"GEO_NAME"- A string value that names the chart.
- Example:
"GeoTab"
"PANE_NAME"- The name of a pane from the pane list (
pList) that the chart should be placed on. The name provided for this argument should match a pane name from the pane list. - Example:
"TopPane"
- The name of a pane from the pane list (
gDef- The geo options list.
gShapes- The shapes layer options list.
gCoords- The coordinate layer options list.
- For geo with shape attributes, simply use an empty bracket set
[]for this argument.
Code Example
This section includes examples for maps with coordinate points, markers, and shape attributes.
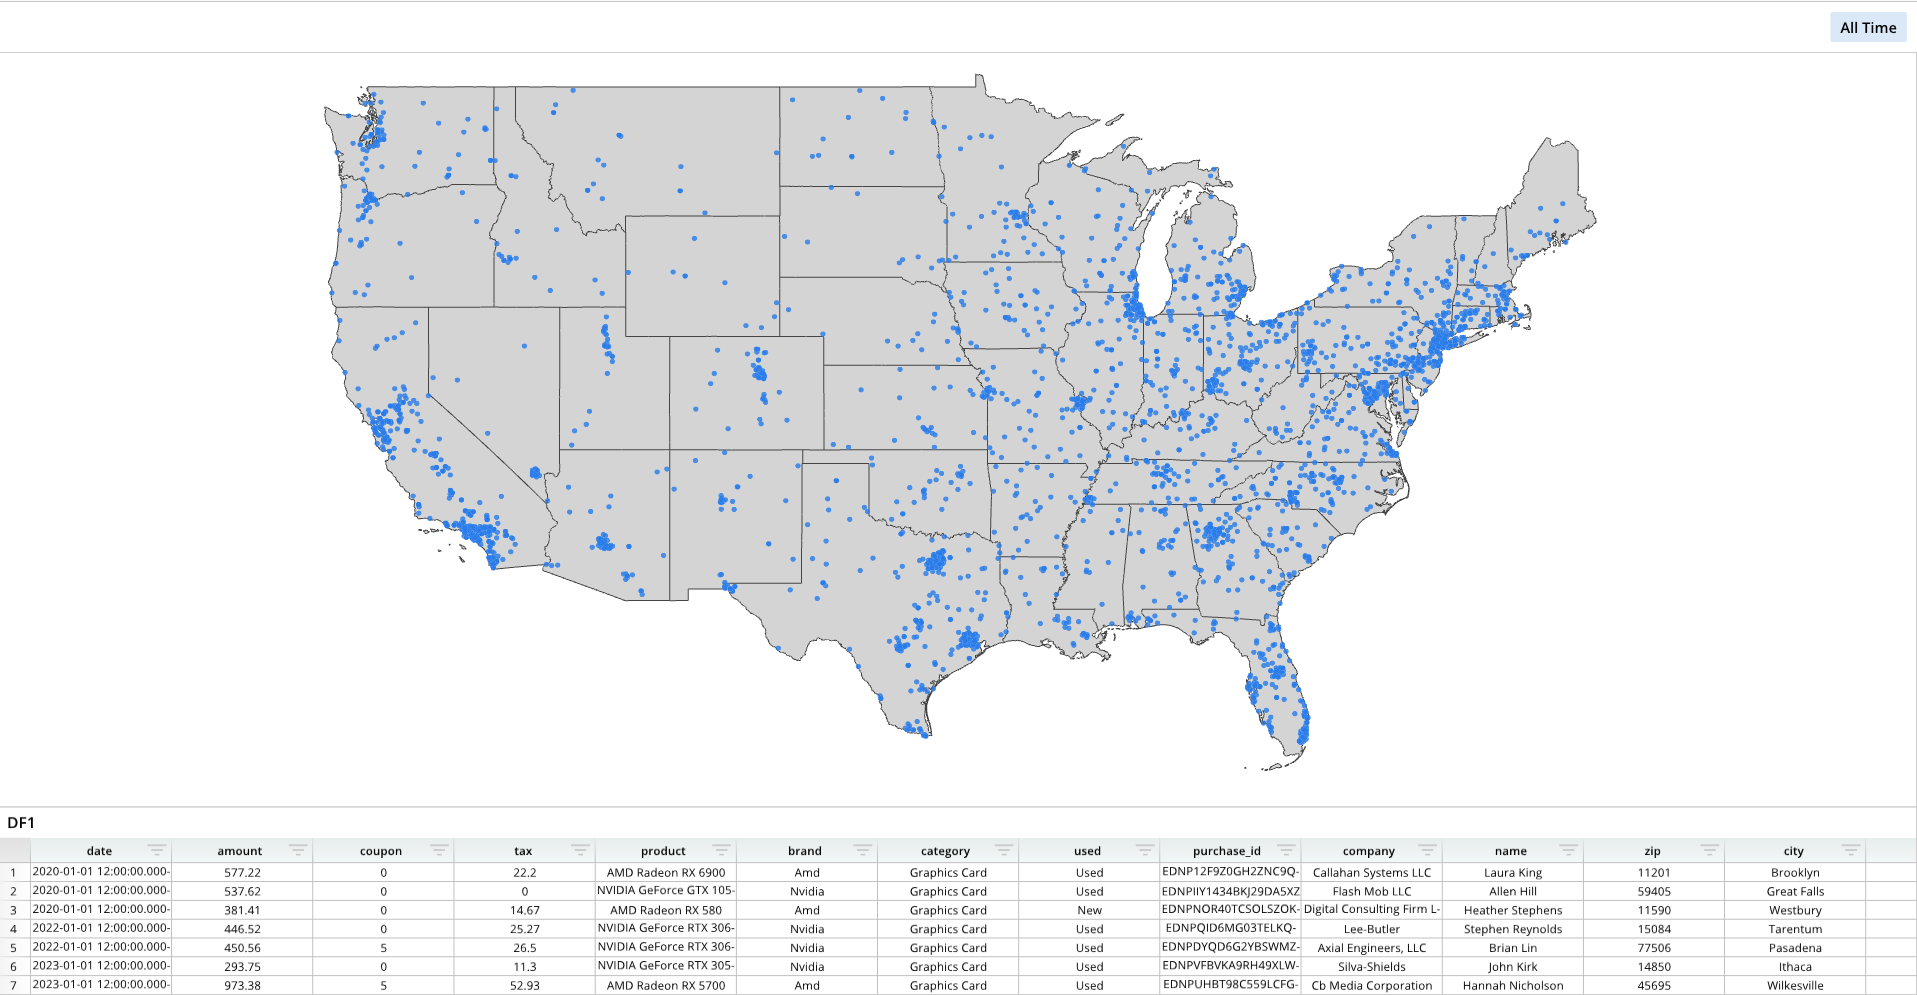
Geo with Coordinates
This example builds a dashboard with a map that uses coordinate points. To use coordinate points, do not include a file path or preset marker name in the SpritePath format option within the gCoords list. Instead, use empty quotation marks "". The visual appearance of the coordinate points is customized in the gCoords list.
# Module import
from row64tools.dash64 import dash64
import os

# Dashboard save path
dash = dash64("/var/www/dashboards/temp/geo.dash")

# Establish dashboard panes
pList = [
    ["Dashboard",       "",             "1600",     "900",  "y"],
    ["TopPane",         "Dashboard",    "*",        "*",    ""],
    ["BottomPane",      "Dashboard",    "*",        "20%",  ""]
]
dash.Layout.set_panes(pList)

# Add a dataframe
dash.add_ramdb("/var/www/ramdb/live/RAMDB.Row64/Examples/HardwareSales.ramdb","DF1")
dash.add_df("DF1", "BottomPane")

# Shape layer options list
gShapes = [
    [
        ["File",os.path.join(dash.get_folder(), "us_states_lines.geo")],
        ["Name","State Borders"],
        ["Color",0x444444]
    ],
    [
        ["File",os.path.join(dash.get_folder(), "us_states_poly.geo")],
        ["Name","Land"],
        ["Color",0xd4d4d4]
    ]
]

# Coordinate layer options list
gCoords = [
    [
        ["Name", "Hardware Sales"],
        ["Lat","=DF1!O:O"],
        ["Lon","=DF1!P:P"],
        ["Visible",True],
        ["Radius",6.5],
        ["Alpha", 0.8],
        ["Mode", "bubble_uniform"],
        ["Color", 0x287BE9],
        ["RingColor", 0xFFFFFF],
        ["RingSize", 0.1],
        ["ColorPalette", [ 0x1B617B, 0x2085A0, 0x46B1D3, 0xAFDEED ]],
        ["SpritePath", ""]
    ]
]

# Geo options list
gDef = [
    ["ProjectionMode",1],
    ["ViewRects",[[15000.000000, 31567.729362, 31666.666667, 41085.522538]]],
    ["ViewNames", ["US Mainland"]]
]

# Add the map to a dashboard pane
dash.add_geo("GeoTab","TopPane", gDef, gShapes, gCoords)

# Save the dashboard
dash.save()
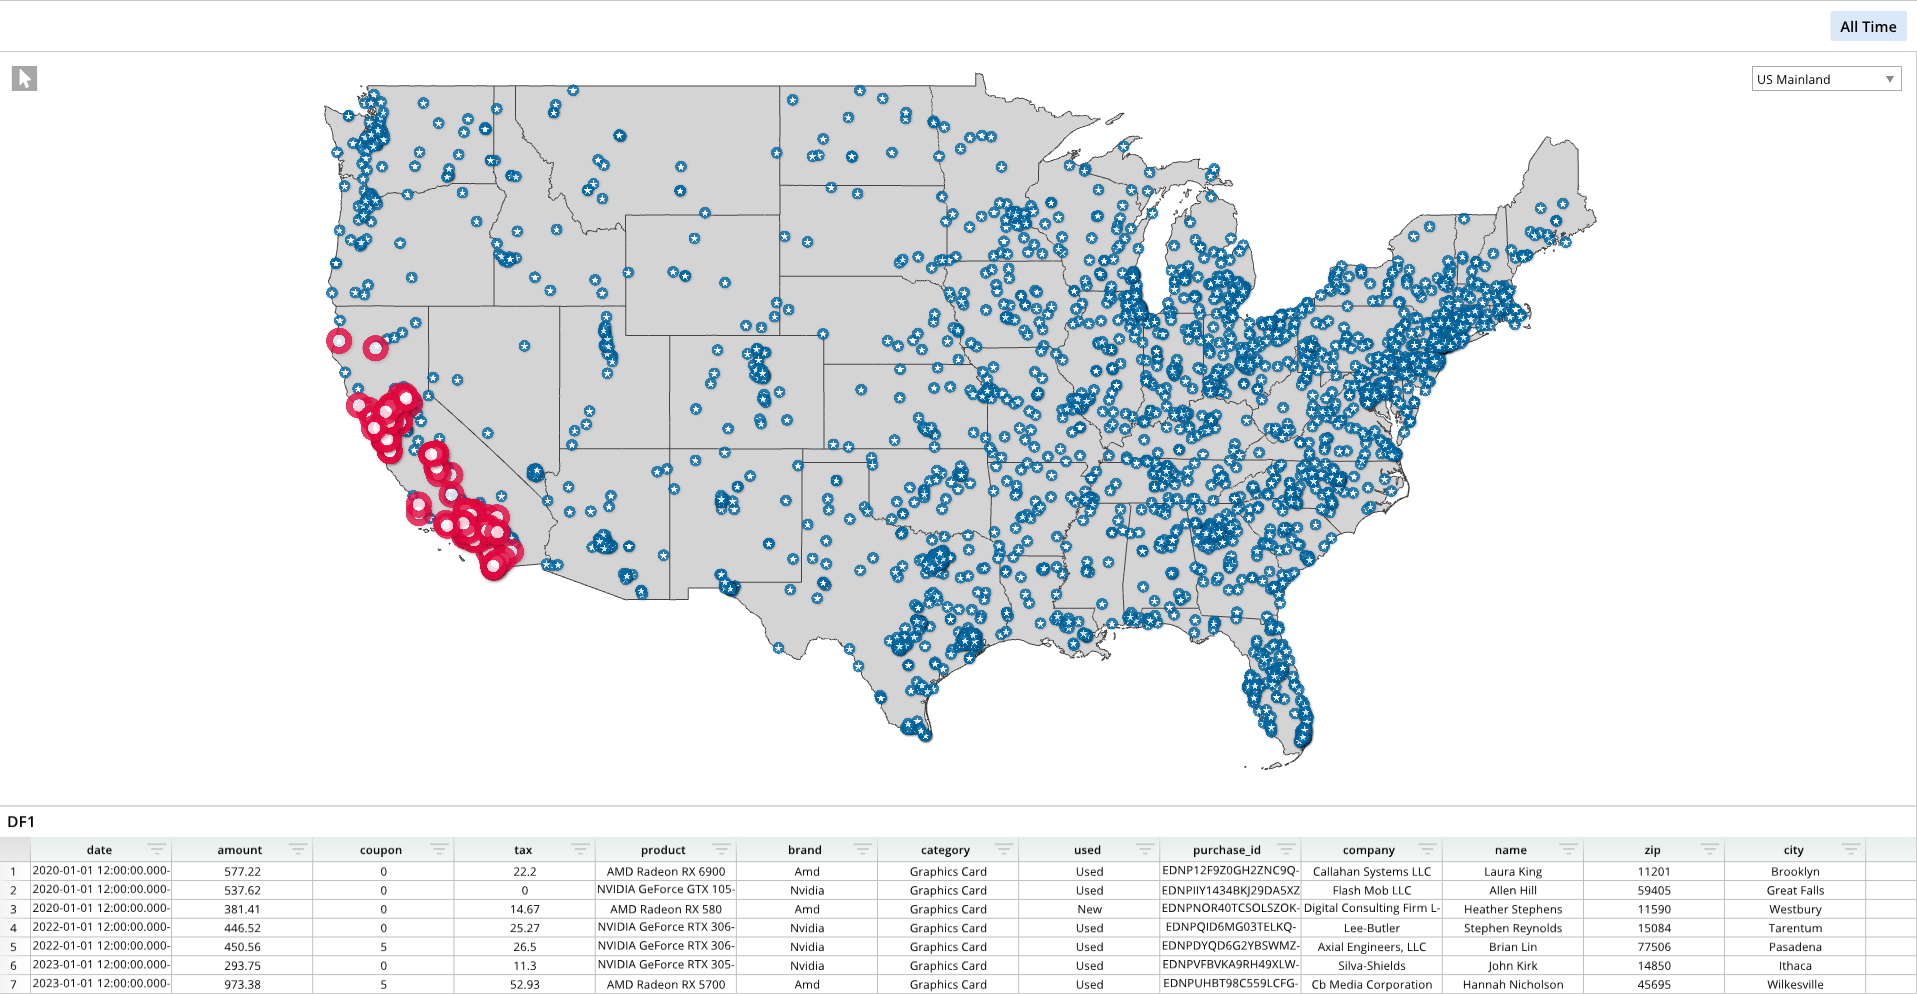
Geo with Markers
The following example uses two dataframes and different markers to distinguish between them. In this specific example, one dataframe represents general data points, and these general data points are displayed on the map as blue circles with stars. The second dataframe is used to identify incidents, which are represented by red circles. These two sprites are individually formatted and mapped to their respective dataframes in the gCoords list.
# Module import
from row64tools.dash64 import dash64
import os

# Dashboard save path
dash = dash64("/var/www/dashboards/temp/geosprite.dash")

# Establish dashboard panes
pList = [
    ["Dashboard",       "",             "1600",     "900",  "y"],
    ["TopPane",         "Dashboard",    "*",        "*",    ""],
    ["BottomPane",      "Dashboard",    "*",        "20%",  ""]
]
dash.Layout.set_panes(pList)

# Add multiple dataframes for general data and incidents
dash.add_ramdb("/var/www/ramdb/live/RAMDB.Row64/Examples/HardwareSales.ramdb","DF1")
dash.add_df("DF1", "BottomPane")
dash.add_ramdb("/var/www/ramdb/live/RAMDB.Row64/Examples/Incident_Reports.ramdb","DF2")

# Shape layer options list
gShapes = [
    [
        ["File",os.path.join(dash.get_folder(), "us_states_lines.geo")],
        ["Name","State Borders"],
        ["Color",0x444444]
    ],
    [
        ["File",os.path.join(dash.get_folder(), "us_states_poly.geo")],
        ["Name","Land"],
        ["Color",0xd4d4d4]
    ]
]

# Coordinate layer options list, which formats markers for general data points (blue star) and incidents (red dot)
gCoords = [
    [
        ["Name", "Incidents"],
        ["Lat","=DF2!D:D"],
        ["Lon","=DF2!E:E"],
        ["Visible",True],
        ["Radius",41.5],
        ["Alpha", 0.8],
        ["Mode", "sprite_uniform"],
        ["Color", 0xFFFFFF],
        ["RingColor", 0xFFFFFF],
        ["RingSize", 0.0],
        ["ColorPalette", [ 0xe3073f, 0x2085A0, 0x46B1D3, 0xAFDEED ]],
        ["SpritePath", "Dot_Red"]
    ],
    [
        ["Name", "Hardware Sales"],
        ["Lat","=DF1!O:O"],
        ["Lon","=DF1!P:P"],
        ["Visible",True],
        ["Radius",18.5],
        ["Alpha", 0.8],
        ["Mode", "sprite_uniform"],
        ["Color", 0xFFFFFF],
        ["RingColor", 0xFFFFFF],
        ["RingSize", 0.0],
        ["ColorPalette", [ 0x1B617B, 0x2085A0, 0x46B1D3, 0xAFDEED ]],
        ["SpritePath", "Star_Blue"]
    ]
]

# Geo options list
gDef = [
    ["ProjectionMode",1],
    ["ViewRects",[[15000.000000, 31567.729362, 31666.666667, 41085.522538]]],
    ["ViewNames", ["US Mainland"]]
]

# Add the map to a dashboard pane
dash.add_geo("GeoTab","TopPane", gDef, gShapes, gCoords)

# Save the dashboard
dash.save()
This example uses preset markers from Row64 Studio. All presets from Row64 Studio are available for use in the DashAPI. To use a preset, specify the preset's name in the SpritePath format option rather than providing a file path (for a custom marker).
The following is a list of all the available marker presets:
- "3D"
- "Box"
- "Building"
- "Building_Button"
- "Car_Button"
- "Check_Blue"
- "Check_Button"
- "Civic"
- "Community"
- "Computer"
- "DWG"
- "Do_Not_Enter"
- "Dot_Blue"
- "Dot_Green"
- "Dot_Red"
- "Education"
- "Fire"
- "Fire_Button"
- "Fire_Hydrant"
- "Flag_Blue"
- "Flag_Red"
- "Flag_Square_Blue"
- "Flag_Teal"
- "FutureTransit"
- "Gear_Blue"
- "Gear_Button"
- "Gear_Teal"
- "House_Button"
- "In_Progress_Pin"
- "Leaf"
- "Leaf_Button"
- "MP4"
- "Mountain"
- "Mountain_Button"
- "PDF"
- "Package"
- "Person_Blue"
- "Person_Grey"
- "Person_Pin"
- "Pin_Blue"
- "Pin_Dark_Blue"
- "Pin_Green"
- "Pin_Red"
- "Pin_Star_Blue"
- "Pin_Star_Red"
- "Pin_Teal"
- "Plus_Button"
- "Push_Pin_Blue"
- "Push_Pin_Red"
- "Push_Pin_Teal"
- "Satellite"
- "Server"
- "Signal"
- "Stack"
- "Star_Black"
- "Star_Blue"
- "Star_Red"
- "Star_Teal"
- "Tech_Stack"
- "Tech_Stack"
- "Tool_Pin"
- "Transit"
- "Tree"
- "Warning_Blue"
- "Warning_Pin_Blue"
- "Warning_Pin_Red"
- "Warning_Red"
- "Warning_White"
- "White_Button"
- "Wireless"
- "X_Button"
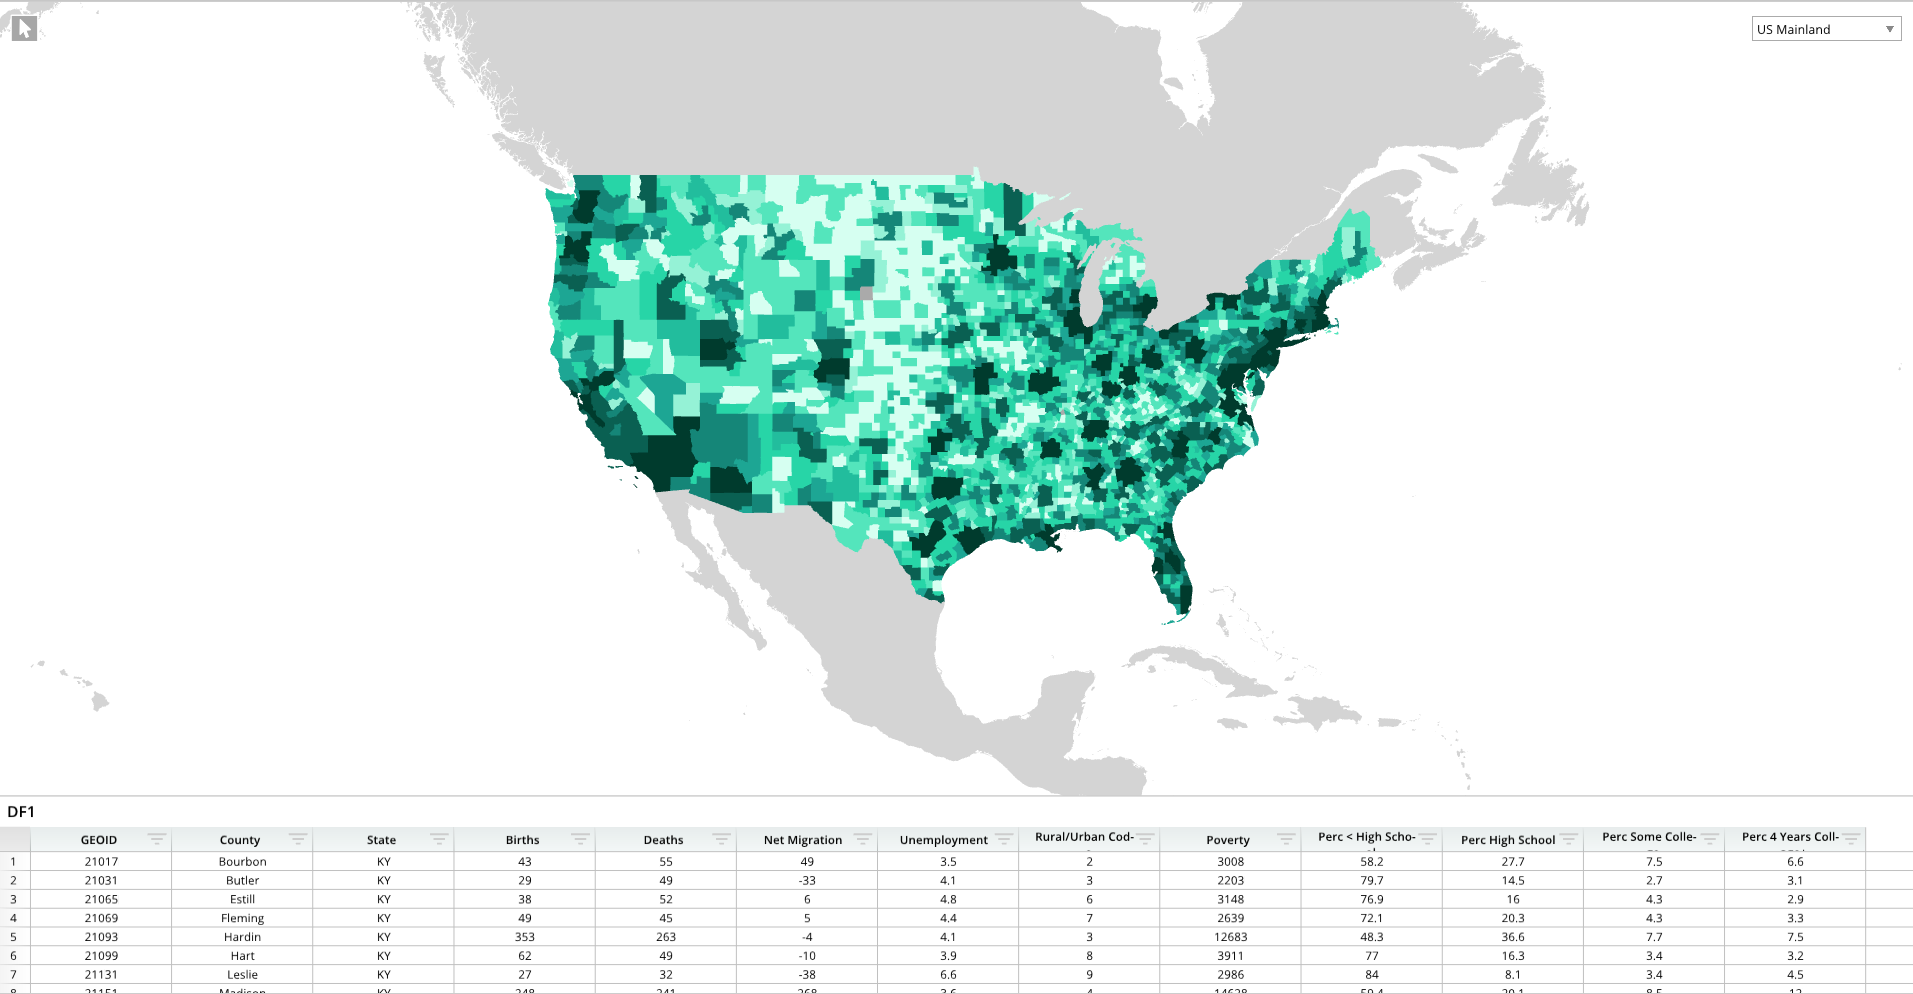
Geo with Shape Attributes
The following example builds a dashboard with a heatmap. Note that this example excludes the gCoord list, which is present in the previous examples, and includes an empty bracket set [] for the gCoord argument in the dash.add_geo() function. To establish the coloring of the heatmap, the ColorValues format option is included in the gShapes list.
# Module import
from row64tools.dash64 import dash64
import os

# Dashboard save path
dash = dash64("/var/www/dashboards/temp/heatmap.dash")

# Establish dashboard panes
pList = [
    ["Dashboard",       "",             "1600",     "900",  "y"],
    ["TopPane",         "Dashboard",    "*",        "*",    ""],
    ["BottomPane",      "Dashboard",    "*",        "20%",  ""]
]
dash.Layout.set_panes(pList)

# Add a dataframe
dash.add_ramdb("/var/www/ramdb/live/RAMDB.Row64/Examples/Census.ramdb","DF1")
dash.add_df("DF1", "BottomPane")

# Shape layer options list
gShapes = [
    [
        ["File",os.path.join(dash.get_folder(), "us_county.geo")],
        ["Name","County"],
        ["Locations","=DF1!A:A"],
        ["ColorValues","=DF1!H:H"],
        ["FeatureIndex",1],
        ["Color",0xAAAAAA]
    ],
    [
        ["File",os.path.join(dash.get_folder(), "world.geo")],
        ["Name","World"],
        ["Color",0xd4d4d4]
    ]
]

# Geo options list
gDef = [
    ["ProjectionMode",1],
    ["ViewRects",[[11245.754788, 28740.170740, 35255.283438, 43976.256955]]],
    ["ViewNames", ["US Mainland"]],
    ["ColorTheme", [0x003b2d, 0x1c9f91, 0x29ddab, 0xd7fff1 ]]
]

# Add the map to a dashboard pane
dash.add_geo("GeoTab","TopPane", gDef, gShapes, [])

# Save the dashboard
dash.save()
Geo Format Options
The following tables list the formatting options for geo diagrams. Include formatting items in the respective gShapes, gCoords, or gDef lists. Each formatting item should be contained in brackets [ ], and formatting items should be separated by commas.
| Format Category | Corresponding List | Description |
|---|---|---|
| Shape Layer Options | gShapes | Specify .geo file and shape layer formatting. |
| Coord Layer Options | gCoords | Format coordinate points and markers. |
| Geo Options | gDef | Projection mode, camera view, heat map color theme. |
Shape Layer Options
| Parameter Keys | Value Type | Example | Description |
|---|---|---|---|
| "File" | string | ["File","/home/row64/geofile.geo"] | File path for .geo |
| "Name" | string | ["Name","State Borders"] | Name of Shape Layer |
| "Color" | int - hex color | ["Color",0x444444] | Color Of Layer |
| "Alpha" | float | ["Alpha",.5] | Transparency Of Layer |
| "LineSize" | float | ["LineSize",.5] | Thickness of Line Drawing in Layer |
| "Visible" | bool | ["Visible",True] | Layer Visibility |
| "Locations" | string | ["Locations","=DF1!A:A"] | sheet/dataframe ref to list of GEOIDs |
| "ColorValues" | string | ["ColorValues","=DF1!H:H"] | sheet/dataframe ref to parallel list of attribute data corresponding to Locations |
| "TimeValues" | string | ["TimeValues","=DF1!I:I"] | sheet/dataframe ref to parallel list of time data corresponding to Locations |
| "FeatureIndex" | int | ["FeatureIndex",1] | Index for the currently selected feature ID |
| "FeatureIDs" | [string ...] | ["FeatureIDs",[" | Used by Studio only. Combo box item list of per-shape attributes from the data file |
Coord Layer Options
| Parameter Keys | Value Type | Example | Description |
|---|---|---|---|
| "Name" | string | ["Name", "Hardware Sales"] | Name of Layer |
| "Lat" | string | ["Lat","=DF1!O:O"] | sheet/dataframe ref to cord location |
| "Lon" | string | ["Lon","=DF1!P:P"] | sheet/dataframe ref to cord location |
| "LinkRadius" | string | ["LinkRadius","=DF1!Q:Q"] | sheet/dataframe ref to cord radius |
| "LinkColor" | string | ["LinkColor","=DF1!R:R"] | sheet/dataframe ref to cord color |
| "Visible" | bool | ["Visible",True] | layer visibility |
| "Radius" | float | ["Radius",18.5] | Coord marker radius in pixels |
| "Alpha" | float | ["Alpha", 0.8] | Transparency of coord marker |
| "Mode" | string or int | ["Mode", "sprite_uniform"] | Either string or int of marker mode: "bubble_varying" or 0 = varying size & color, "bubble_uniform" or 1 = same size & color, "sprite_varying" or 2 = sprites varying size, "sprite_uniform" or 3 = sprites same size |
| "Color" | int - hex color | ["Color", 0xFFFFFF] | Color of marker |
| "RingColor" | int - hex color | ["RingColor", 0xFFFFFF] | Ring Color of marker |
| "RingSize" | float | ["RingSize", 0.0] | Ring Size of Marker |
| "ColorPalette" | [float,float,float,float] | ["ColorPalette", [ 0x1B617B, 0x2085A0, 0x46B1D3, 0xAFDEED ]] | Color Theme for Marker |
| "SpritePath" | string | ["SpritePath", "Star_Blue"] | Path to .png or preset name from MarkerExamples.py |
Geo Options
| Parameter Keys | Value Type | Example | Description |
|---|---|---|---|
| "BkgdFill" | int - hex color | ["BkgdFill",0x000000] | Background color of the chart |
| "ProjectionMode" | int | ["ProjectionMode",1] | 0 = None, 1 = Mercator, 2 = Mercator HD, 3 = Mercator HDX |
| "ProjectionData" | int | ["ProjectionData",[-180.0, 180.0, -85.0, 85.0, 6.0]] | Mercator HDX Settings - lon/lat bounding box across all shape levels - { lonMin, lonMax, latMin, latMax, exponent } |
| "ViewRects" | [[float,float,float,float]...] | ["ViewRects",[[11245.754788, 28740.170740, 35255.283438, 43976.256955]]] | Camera view rectangles [[ minX, minY, maxX, maxY ]] |
| "ViewNames" | [string...] | ["ViewNames", ["US Mainland"]] | Camera view names |
| "ColorTheme" | [int,int,int,int] | ["ColorTheme", [0x003b2d, 0x1c9f91, 0x29ddab, 0xd7fff1 ]] | Color Theme of Attribute Heat Map |