Slider and Equation
A slider can be added to a dashboard pane and linked to a formula and dataset to easily filter data.
Required Components
Adding a slider to a dashboard pane requires the following components:
wOptions = []- A list that contains formatting options for the widget, which includes visual formatting and a reference to a dataframe or data node.
dash.add_widget()- A generic function that adds widgets to dashboard panes. The type of widget to add is specified in an argument.
fontDef = [](Optional - For text only)- A list that contains text formatting. This list is applied to text on a dashboard pane in the
paneDeflist.
- A list that contains text formatting. This list is applied to text on a dashboard pane in the
eqDef = [](Optional - For text only)- A list that contains text and number formatting options for the number outputted by the slider, if a number is outputted to a dashboard pane for display.
paneDef = [](Optional - For text only)- The list that formats the targeted dashboard pane. The
fontDefandeqDeflists are referenced in this list. - The
paneDeflist contains the equation that is linked to the slider.
- The list that formats the targeted dashboard pane. The
dash.add_to_pane()(Optional - For text only)- The function that adds any text and its associated formatting to a dashboard pane.
- This function is not required if you are not adding text to a dashboard pane.
Components Syntax
wOptions
wOptions = [
    ["OPTION_1", VALUE_1],
    ["OPTION_2", VALUE_2],
    ...
]
The wOptions list contains formatting options for the widget. This list specifies the data range to use, and can include visual formatting selections, such as labels and padding. List items contain option names and option values.
For creating a slider widget, include the "Grid" format item, which is a list that specify's the slider's action option index, default value, minimum value, and maximum value.
The following is a full wOptions example that links the slider to a data range, adds labels and padding, and includes the "Grid" item:
wOptions = [
    ["Label","Max Amount:"],
    ["Column","=DF1!B:B"],
    ["Padding",0.23],
    ["Grid",[["0"],["210"],["0"],["1500"]]] # Action Option Index, Default, Min, Max
]
dash.add_widget()
dash.add_widget("WIDGET_TYPE", "PANE_NAME", wOptions)
The dash.add_widget() is a generic function that adds widgets to a dashboard pane. The type of widget to add is specified in an argument.
"WIDGET_TYPE"- The name of the type of widget to add.
- For adding a slider, this argument should be:
"Slider"
"PANE_NAME"- The name of a pane from the pane list (
pList) that the widget should be placed on. The name provided for this argument should match a pane name from the pane list.
- The name of a pane from the pane list (
wOptions- The widget formatting list.
fontDef
fontDef = [
    ["OPTION_1", VALUE_1],
    ["OPTION_2", VALUE_2],
    ...
]
The fontDef list contains formatting options for any text that is to be added to a dashboard pane. This list is included in the paneDef list, which is the list that contains the actual text and equations to be added to the pane.
Some of the common fontDef options may include:
"fontSize""VerticalSpace""Bold""Italic""Underline""Align""Color"
The following is an example of a fontDef list with text formatting options. Below the fontDef list is a paneDef list, which includes a reference to the fontDef list for formatting the "Filtered Sum" text that is being applied to a dashboard pane (please see the full code example for the entire context):
...

fontDef = [
    ["FontSize",52],
    ["VerticalSpace",32],
    ["Bold"],
    ["Italic"],
    ["Underline"],
    ["Align",.5],
    ["Color",0x4a89e7]
]

...

paneDef = [
    ["Color",0xF1F1F1],
    ["Text",dash.format_text("Filtered Sum",fontDef)],
    ["Equation",dash.format_equation("=SUM(DF1!B:B)",eqDef)]
]

...
eqDef
eqDef = [
    ["OPTION_1", VALUE_1],
    ["OPTION_2", VALUE_2],
    ...
]
The eqDef list, like the fontDef list, contains formatting options for numbers outputted to a dashboard pane, which are the result of an equation. The eqDef list shares many of the options as the fontDef list. Unlike the fontDef list, the eqDef list can include number format codes.
Like the fontDef list, the eqDef list is referenced in the paneDef list, which contains the actual equation to print to a dashboard pane.
The following is an example of an eqDef list and a paneDef list, which references the eqDef list to apply formatting to the numeric result of an equation that is performed on an underlying dataframe:
...

eqDef = [
    ["FontSize",45],
    ["Bold"],
    ["Color",0x3a5e70],
    ["Format","#,##0.00"]
]

...

paneDef = [
    ["Color",0xF1F1F1],
    ["Text",dash.format_text("Filtered Sum",fontDef)],
    ["Equation",dash.format_equation("=SUM(DF1!B:B)",eqDef)]
]

...
paneDef
paneDef = [
    ["OPTION_1", VALUE_1],
    ["OPTION_2", VALUE_2],
    ...
]
The paneDef list is the list that contains the actual text and equations to be printed to dashboard panes. When specifying text or equations, formatting lists, such as fontDef and eqDef, can be included to visually modify its appearance.
The paneDef list can change the background color of a pane, and add and format text and equations. When adding and formatting text, include a list option with the "Text" tag, and include the desired text with a formatting list. For equations, use the "Equation" tag, followed by the equation to use and a formatting list.
To add and format text, include the dash.format_text("TEXT", FORMAT_LIST) function in the paneDef list. For equations, use the dash.format_equation("EQUATION", FORMAT_LIST) function. These functions are invoked after the corresponding paneDef label, such as "Text" or "Equation" (see the example below).
The following is a paneDef example that colors a dashboard pane, adds and formats text, and adds and formats an equation:
...

paneDef = [
    ["Color",0xF1F1F1],
    ["Text",dash.format_text("Filtered Sum",fontDef)],
    ["Equation",dash.format_equation("=SUM(DF1!B:B)",eqDef)]
]

...
dash.add_to_pane()
dash.add_to_pane("PANE_NAME", paneDef)
The dash.add_to_pane() function adds the text or equations, with all associated formatting lists, to a specified dashboard pane. This function is only needed when adding text and equations to a dashboard pane, and is not required when only adding a slider widget.
"PANE_NAME"- The name of a pane from the pane list (
pList) that the text should be placed on. The name provided for this argument should match a pane name from the pane list.
- The name of a pane from the pane list (
paneDef- The
paneDeflist, which contains the text and equations to add to a pane, along with associated formatting lists.
- The
Code Example
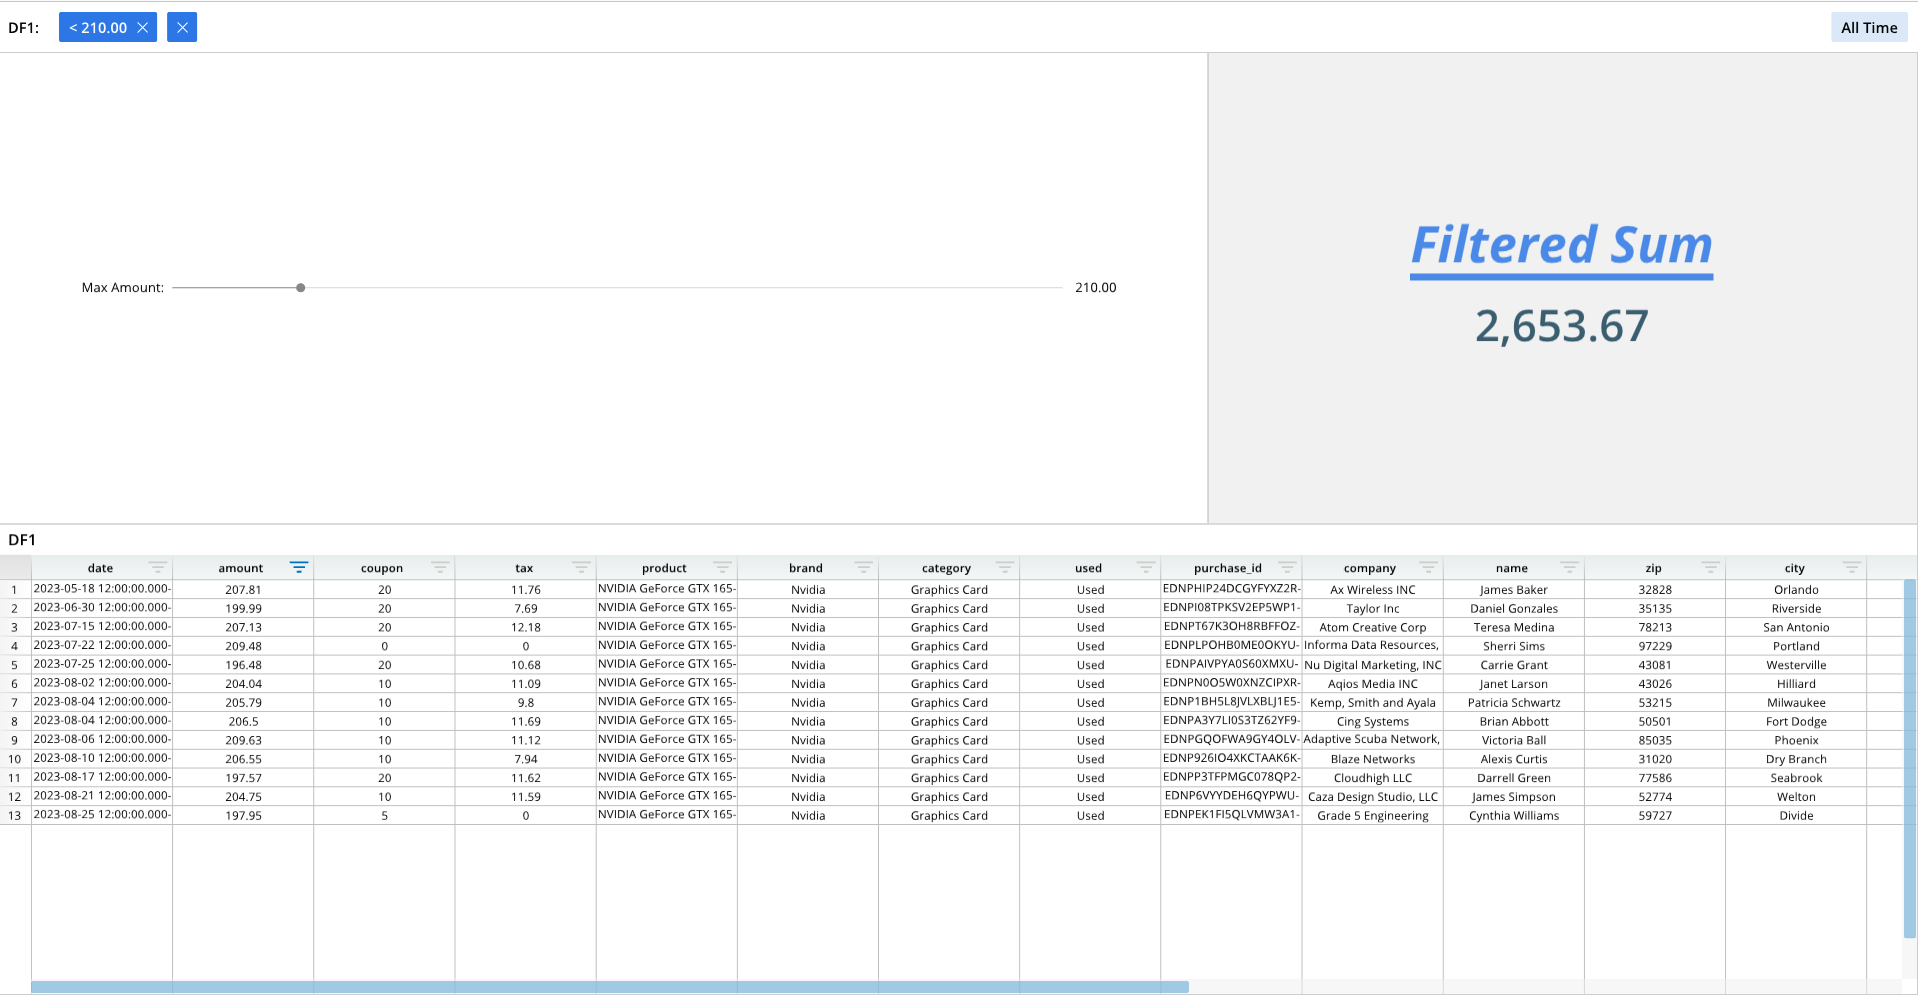
The following example generates a dashboard with a slider and formatted text. The slider is applied to the left pane, and is tied to the underlying dataframe. Text and an equation is printed and formatted on the right pane. The pane on the right has a static text title, with a dynamic equation that calculates and updates a number based on the position of the slider.
# Module import
from row64tools.dash64 import dash64

# Dashboard save location
dash = dash64("/var/www/dashboards/temp/slider.dash")

# Pane list
pList = [
    ["Dashboard",       "",     "1600",     "900",  "y"],
    ["TopPane",     "Dashboard",    "*",        "*",    "x"],
    ["BottomPane",      "Dashboard",    "*",        "*",    ""],
    ["LeftPane",        "TopPane",  "63%",      "*",    ""],
    ["RightPane",       "TopPane",  "37%",      "*",    ""]
]

# Set panes
dash.Layout.set_panes(pList)

# Import a dataframe
dash.add_ramdb("/var/www/ramdb/live/RAMDB.Row64/Examples/HardwareSales.ramdb","DF1")

# Add the dataframe to a dashboard pane
dash.add_df("DF1", "BottomPane")

# Slider options
# For slider Action Option Index:
# 0 = Less Than Slider Value, 1 = Greater than Slider Value, 2 = Equal To Slider Value
wOptions = [
    ["Label","Max Amount:"],
    ["Column","=DF1!B:B"],
    ["Padding",0.23],
    ["Grid",[["0"],["210"],["0"],["1500"]]] # Action Option Index, Default, Min, Max
]

# Add the slider to a pane
dash.add_widget("Slider", "LeftPane", wOptions)

# Formatting list for text to be added to a pane
fontDef = [
    ["FontSize",52],
    ["VerticalSpace",32],
    ["Bold"],
    ["Italic"],
    ["Underline"],
    ["Align",.5],
    ["Color",0x4a89e7]
]

# Formatting list for equation to be added to a pane
eqDef = [
    ["FontSize",45],
    ["Bold"],
    ["Color",0x3a5e70],
    ["Format","#,##0.00"]
]

# List of text, equations, and formatting for the pane
paneDef = [
    ["Color",0xF1F1F1],
    ["Text",dash.format_text("Filtered Sum",fontDef)],
    ["Equation",dash.format_equation("=SUM(DF1!B:B)",eqDef)]
]

# Apply the text, equations, and formatting to a dashboard pane
dash.add_to_pane("RightPane", paneDef)

# Save the dashboard
dash.save()