Creating and Modifying Dashboards
Creating dashboards from scratch and modifying existing dashboards involve slightly different workflows. When creating new dashboards, you need to specify the layout and formatting, whereas if you want to modify an existing dashboard, you don't need to establish a layout, since one already exists (such as from Studio, for example). Rather, you would need to identify and change the desired component.
Creating New Dashboards
To create new dashboards through the DashAPI, you must include the following components in the Python configuration files:
- Module import
- row64tools and the DashAPI are modules that must be imported to the Python file.
- Example:
from row64tools.dash64 import dash64
- Dashboard save path
- Specify the local file path where the dashboard (
.dash) file should be saved. When the configuration executes, the dashboard file is saved to this location. - Example:
dash = dash64("/var/www/dashboards/temp/layout.dash")
- Specify the local file path where the dashboard (
- Pane layout
- When creating a new dashboard, you need to define the dashboard's pane structure, which is accomplished by adding entries into the pane list (
pList) block. Each entry in the pane list establishes a pane, and each pane entry consists of five columns. From left to right, the columns are: Pane name, parent pane, width, height, and division axis, respectively. - To learn more about defining a dashboard's pane structure through the pane list, please see the Dashboard Layout page.
- When creating a new dashboard, you need to define the dashboard's pane structure, which is accomplished by adding entries into the pane list (
- Set panes
- The pane list (
pList) block is simply a list of the dashboard's panes and their properties. To apply the panes of the pane list to the dashboard, you must use thedash.Layout.set_panes()function and passpListas the argument. - Example:
dash.Layout.set_panes(pList)
- The pane list (
- Pane formatting
- Dashboard panes can be formatted with colors and text. Panes are formatted through the
dash.set_pane_def()function, where the formatting properties are passed into the function as arguments. - Example:
dash.set_pane_def("Header", [["Color",0xa2e9dc],["Text","Header","BH2V2S35"]]) - To learn more about formatting panes and how to use the
dash.set_pane_def()function, please see the Pane Formatting page.
- Dashboard panes can be formatted with colors and text. Panes are formatted through the
- Pane content
- Once the dashboard panes are defined, content can be added to each pane. Any type of data or content that is supported by Row64 Studio is supported by the DashAPI.
- Different functions are needed for placing different types of content. For instance, to place a dataframe on a pane, you would first need to load the dataframe with the
dash.add_ramdb()function, and then add it to a pane using thedash.add_df()function. - To learn how to place different types of content on dashboard panes, such as Dataframes, Charts, and more, please refer to the Dashboard Content section of the DashAPI documentation. You can also reference the DashAPI Examples page for a list of DashAPI dashboard examples.
- Save dashboard
- The function that saves the dashboard to a file when the configuration file is executed.
- Example:
dash.save()
Example 1
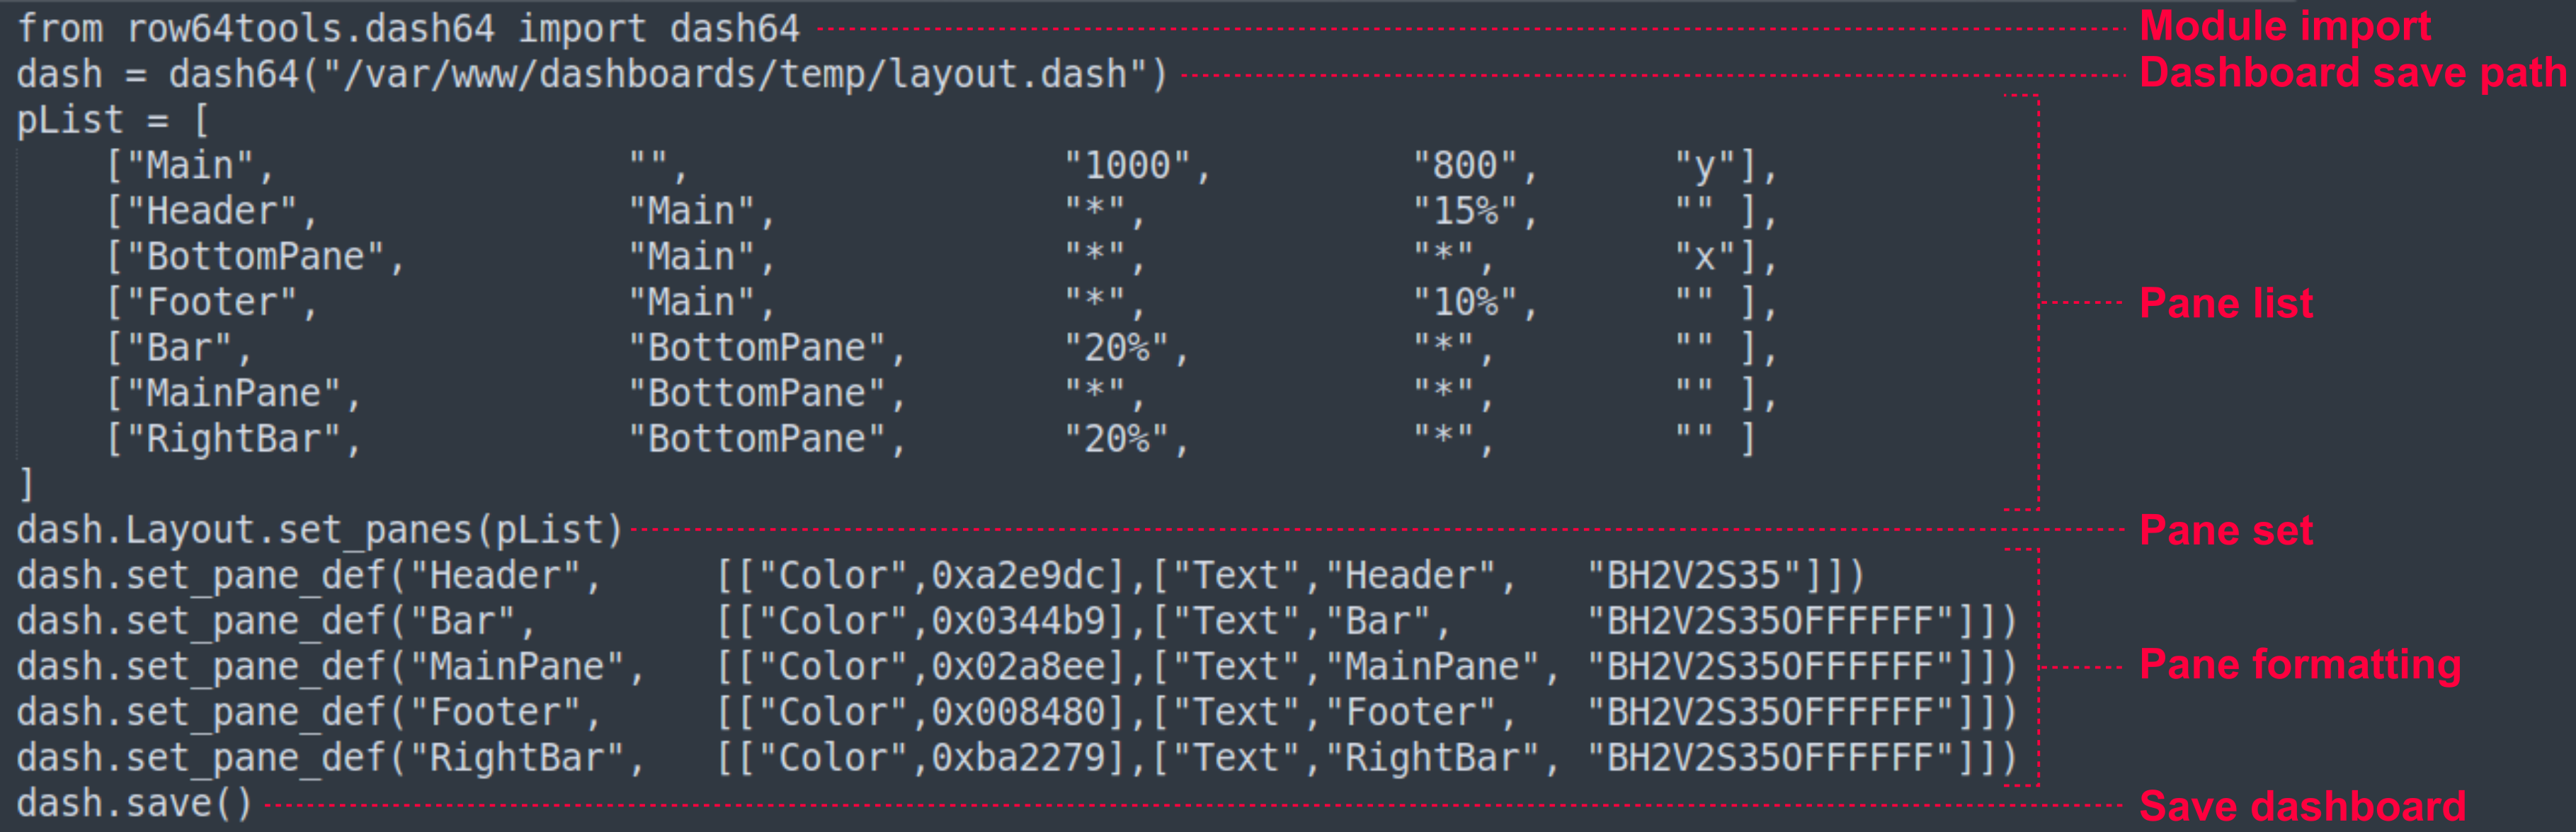
The following example creates and formats a basic dashboard, but does not add content to any of the panes:
from row64tools.dash64 import dash64
dash = dash64("/var/www/dashboards/temp/layout.dash")
pList = [
    ["Main",                "",                 "1000",         "800",      "y"],
    ["Header",              "Main",             "*",            "15%",      "" ],
    ["BottomPane",          "Main",             "*",            "*",        "x"],
    ["Footer",              "Main",             "*",            "10%",      "" ],
    ["Bar",                 "BottomPane",       "20%",          "*",        "" ],
    ["MainPane",            "BottomPane",       "*",            "*",        "" ],
    ["RightBar",            "BottomPane",       "20%",          "*",        "" ]
]
dash.Layout.set_panes(pList)
dash.set_pane_def("Header", [["Color",0xa2e9dc],["Text","Header","BH2V2S35"]])
dash.set_pane_def("Bar", [["Color",0x0344b9],["Text","Bar","BH2V2S35OFFFFFF"]])
dash.set_pane_def("MainPane", [["Color",0x02a8ee],["Text","MainPane","BH2V2S35OFFFFFF"]])
dash.set_pane_def("Footer", [["Color",0x008480],["Text","Footer","BH2V2S35OFFFFFF"]])
dash.set_pane_def("RightBar", [["Color",0xba2279],["Text","RightBar","BH2V2S35OFFFFFF"]])
dash.save()
The code produces the following dashboard:
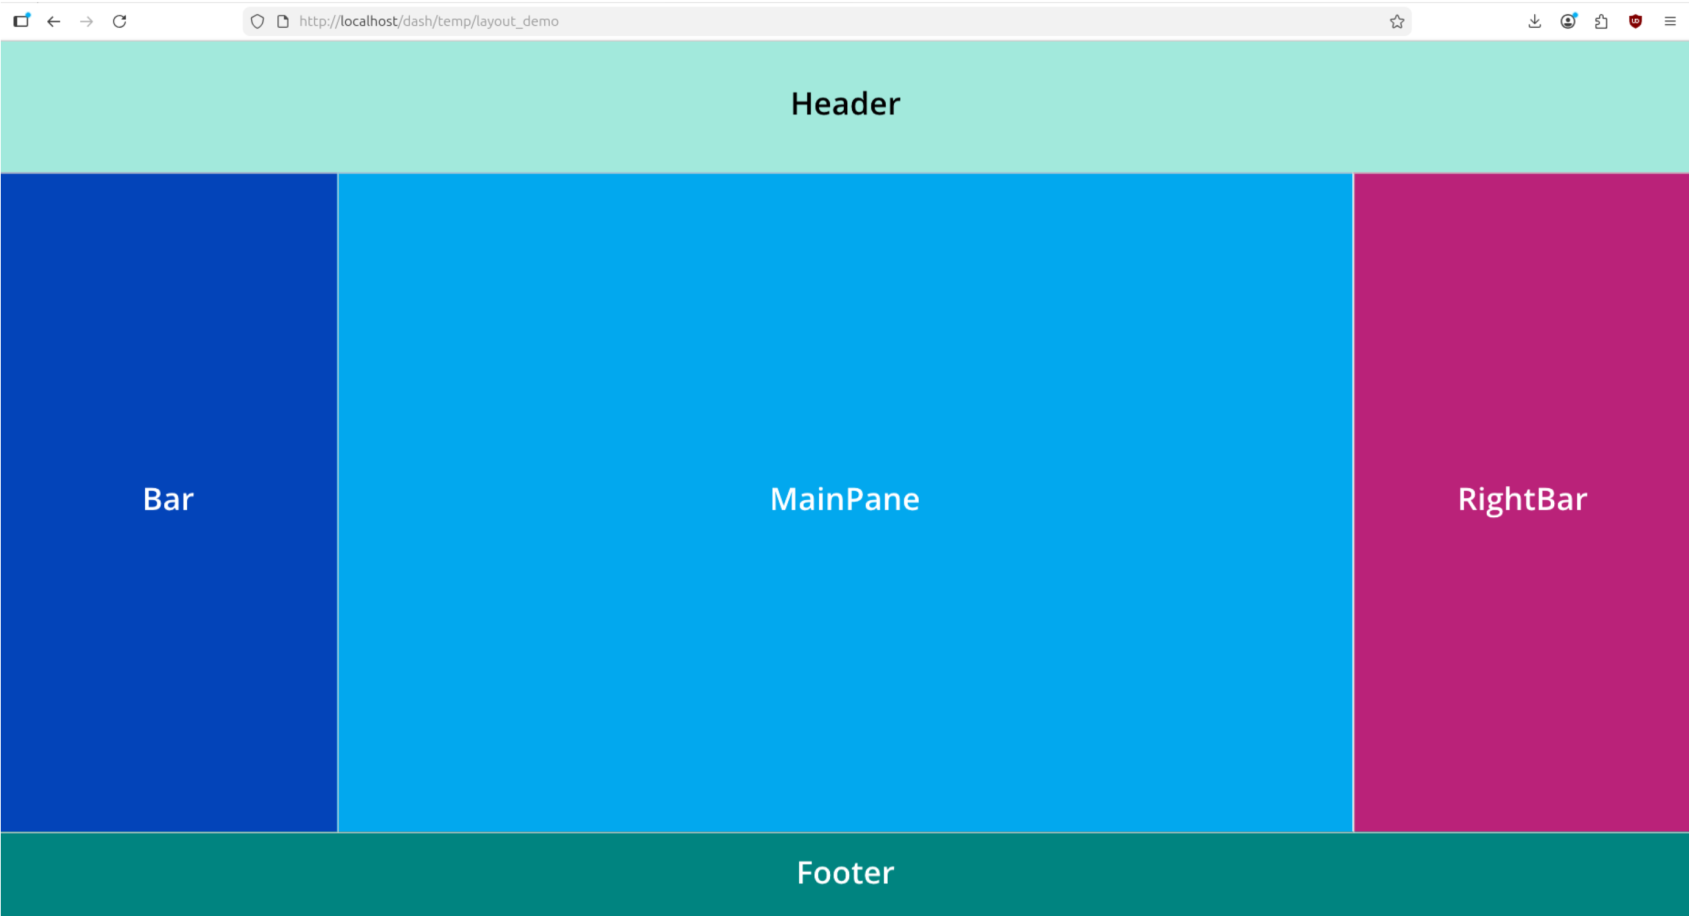
Although this example successfully generates a dashboard, the dashboard panes do not have any content.
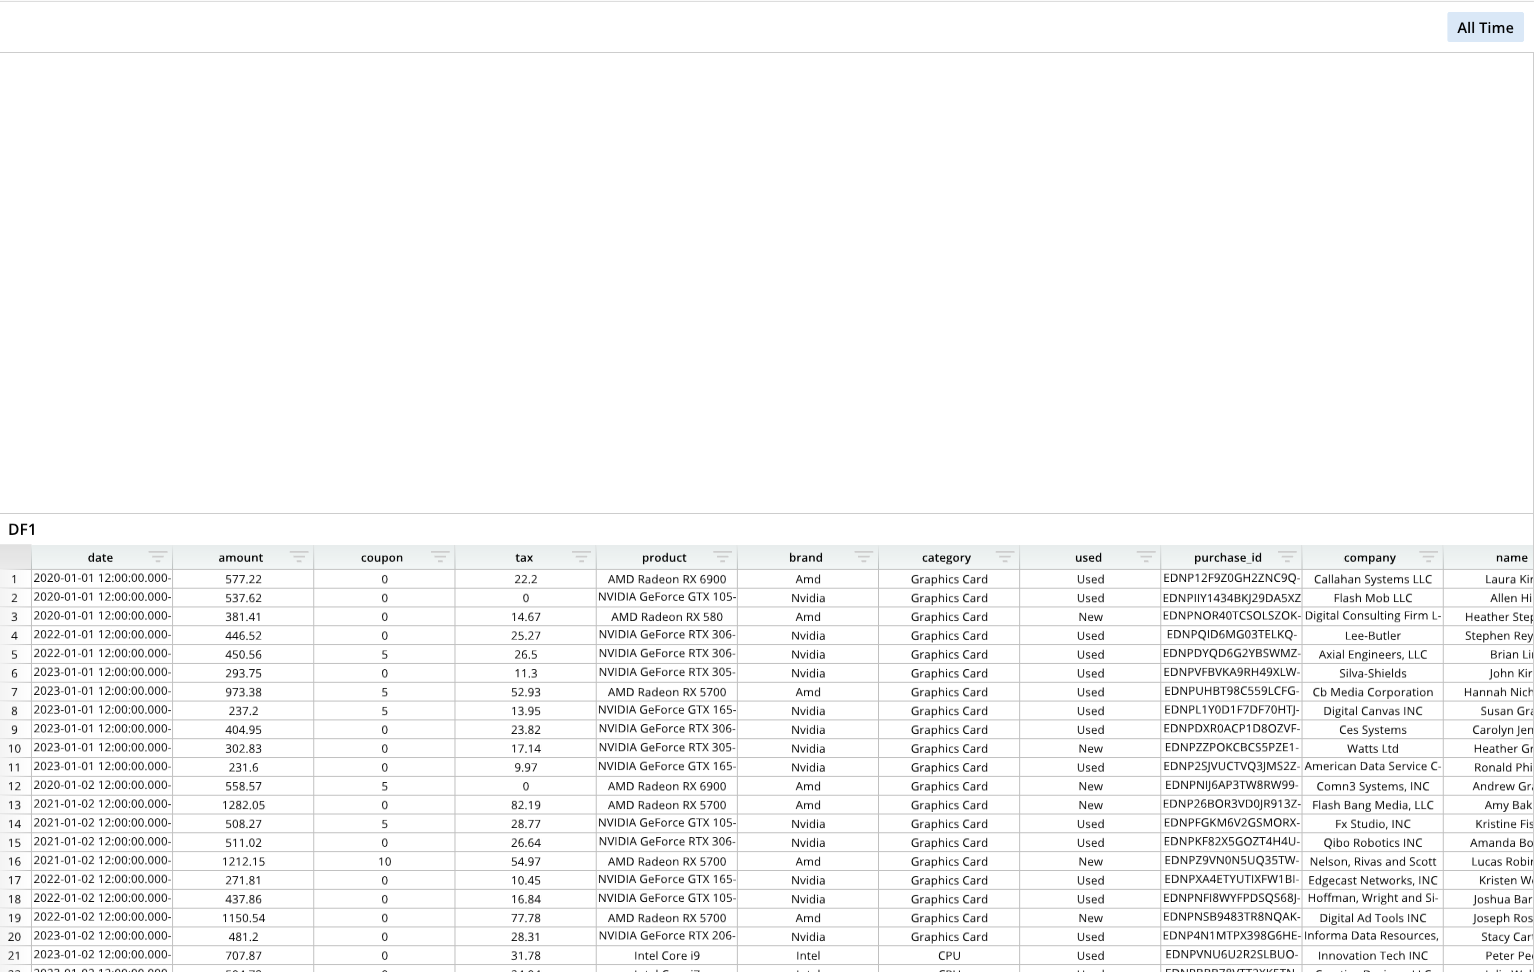
Example 2
Consider a new example that both generates a new custom dashboard from scratch and adds content to its frames:
from row64tools.dash64 import dash64
dash = dash64("/var/www/dashboards/temp/dframe_demo.dash")
pList = [
    ["Dashboard",       "",             "1600",     "900",  "y"],
    ["TopPane",         "Dashboard",    "*",        "*",    ""],
    ["BottomPane",      "Dashboard",    "*",        "50%",  ""]
]
dash.Layout.set_panes(pList)
dash.add_ramdb("/var/www/ramdb/live/RAMDB.Row64/Examples/HardwareSales.ramdb","DF1")
dash.add_df("DF1", "BottomPane")
dash.save()
This configuration contains similar code components as the previous example, including the module import, the save path, the pane list, and the function to set the panes. This example does not format the dashboard panes, however. This dashboard consists of two visible children panes, TopPane and BottomPane, and an underlying construction, or parent, pane.
A dataframe is retrieved from the local location /var/www/ramdb/live/RAMDB.Row64/Examples/HardwareSales.ramdb and given a Row64 tag (DF1) through the dash.add_ramdb() function. Then, this dataframe is added to the dashboard's BottomPane with the dash.add_df() function. The dash.add_df() function takes two arguments: the identifier, or tag, of the dataframe to add, and the name of the pane to add it to.
Tip
These dashboards pull example dataframes from the /var/www/ramdb/live/RAMDB.Row64/Examples/ directory, where the Row64 dashboard examples are loaded when installing Row64 Server. Specifically, running the Connect_Ubuntu.py script when following the server installation documentation (find your relevant operating system) creates the example files. These examples are ready to use, so you should be able to run the DashAPI examples throughout this guide without having to create your own dataframes.
Different functions are needed for adding different types of dashboard pane content. Since this example is working specifically with dataframes, the dash.add_ramdb() is used to retrieve a dataframe file, and the dash.add_df() function places the retrieved dataframe to the dashboard. More information on working with dataframes is available in the Dataframes page.
Example 3
This example creates a new dashboard and, like the previous examples, provides the required code components to create a dashboard through the DashAPI. This example differs, however, in that it places a line chart in addition to a dataframe:
from row64tools.dash64 import dash64
dash = dash64("/var/www/dashboards/temp/line.dash")
pList = [
    ["Dashboard",       "",             "1600",     "900",  "y"],
    ["TopPane",         "Dashboard",    "*",        "*",    ""],
    ["BottomPane",      "Dashboard",    "*",        "20%",  ""]
]
dash.Layout.set_panes(pList)
dash.add_ramdb("/var/www/ramdb/live/RAMDB.Row64/Examples/MultipleStocks.ramdb","DF1")
dash.add_df("DF1", "BottomPane")
lDef = [
    [ "AAPL", "=DF1!A:A", "=DF1!D:D" ], # Name, Labels, Values
    [ "NVDA", "=DF1!A:A", "=DF1!E:E" ]
]
lOptions = [
    ["Format","GridlineX","Type",2],  # Categorical:0, Numeric:1, DateTime:2
    ["Format","AxisX","LabelFormat","mm-yy"],
    ["Series",0,"Line","Color", 0xFF004A],  # 0x3178FA
    ["Series",0,"FillType",2], # 0=None, 1=Fill, 2=Gradient
    ["Series",0,"Fill","Color",0xFF004A],
    ["Series",0,"Fill","Alpha",.3],
    ["Series",1,"Line","Color", 0x3178FA],
    ["Series",1,"FillType",2],
    ["Series",1,"Fill","Color",0x3178FA],
    ["Series",1,"Fill","Alpha",.3]
]
dash.add_line("Line1", "TopPane", lDef, lOptions)
dash.save()
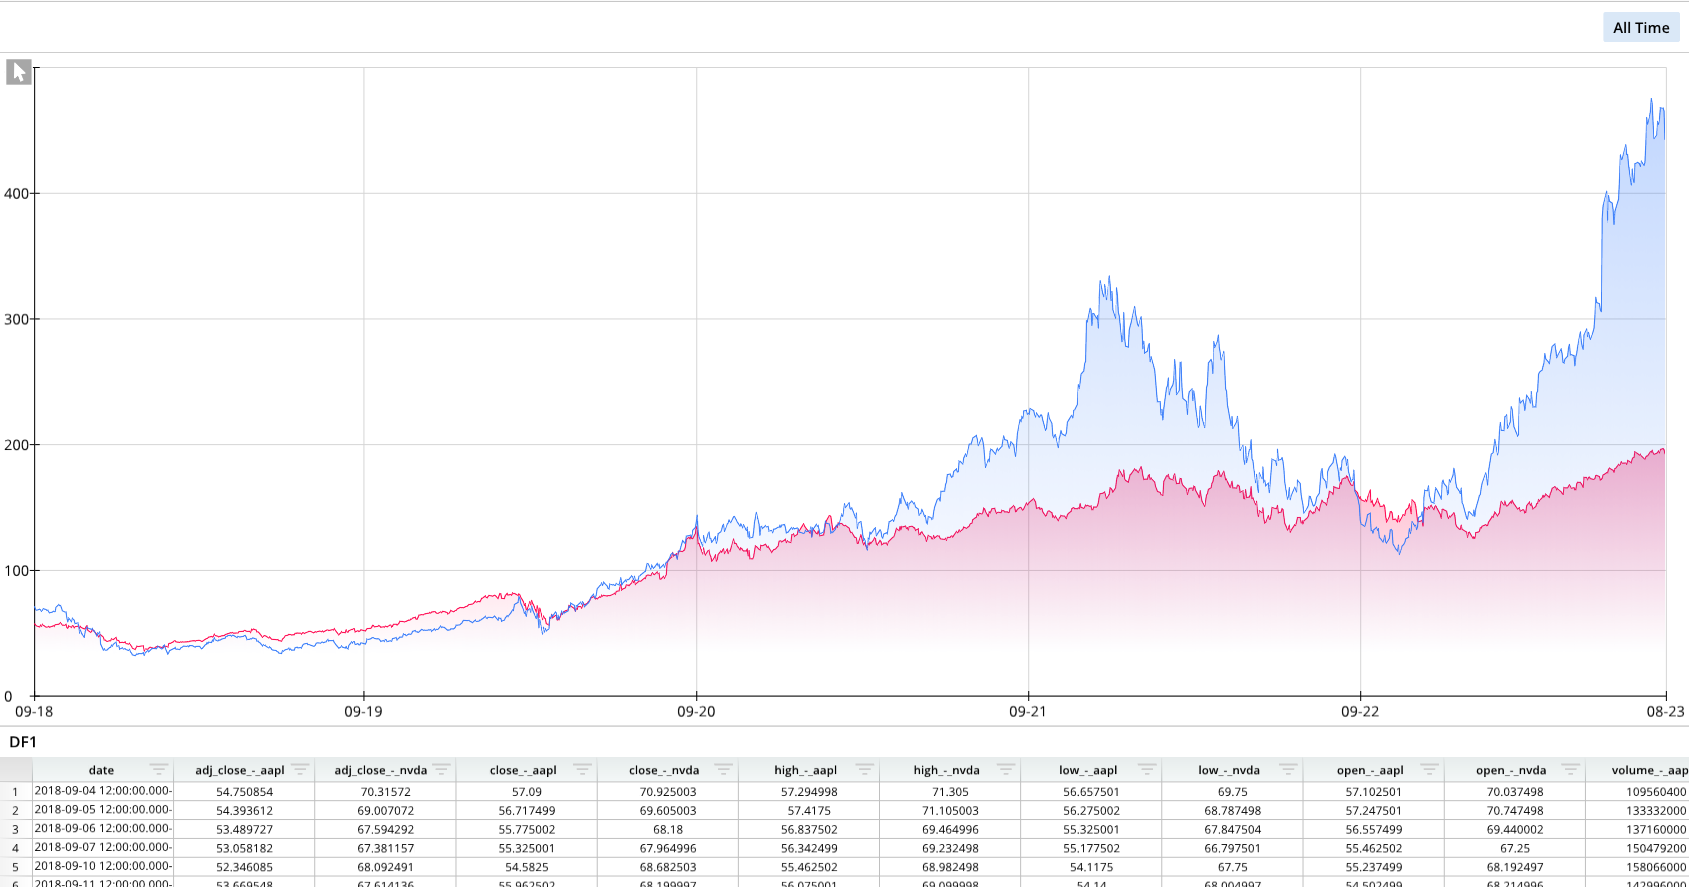
Notice how the first half of the configuration code is familiar and includes the needed components previously discussed. Below the dashboard pane configuration code, a dataframe is retrieved with the dash.add_ramdb() function and added to a pane with the dash.add_df() function. After the dataframe, a line chart is formatted with the lDef ("line definition") and lOptions ("line options") lists. Finally, the line chart is added to a designated pane using the dash.add_line() function.
This example demonstrates how different types of pane content requires different functions and lists. To learn how to add different types of content to dashboards, please explore the Dashboard Content section.
Modify Existing Dashboards
The DashAPI is capable of modifying existing dashboards. Editing existing dashboards involves specifying the desired dashboard's file path and writing modifications. When modifying existing dashboards, defining a pane list (pList), setting the panes (dash.Layout.set_panes(pList)), and adding content to the panes is not needed, since these properties were established in the dashboard creation workflow or through Row64 Studio.
Common components in a dashboard modification Python configuration file include:
- Module import
- row64tools and the DashAPI are modules that must be imported to the Python file.
- Example:
from row64tools.dash64 import dash64 - The dashboard modification workflow requires the additional import of the Python
osmodule. - Example:
import os
- Dashboard save path
- Specify the local file path where the modified dashboard (
.dash) file should be saved. When the configuration executes, the dashboard file is saved to this location. - Example:
dash = dash64("/var/www/dashboards/temp/mod.dash")
- Specify the local file path where the modified dashboard (
- Existing dashboard location
- The location of the existing dashboard to load and edit.
- Example:
dash.load("/var/www/dashboards/examples/amazon.dash")
- Modification functions and commands
- The remainder of the dashboard modification Python file consists of the modification commands.
- Save dashboard
- The function that saves the dashboard to a file when the configuration file is executed.
- Example:
dash.save()
Example
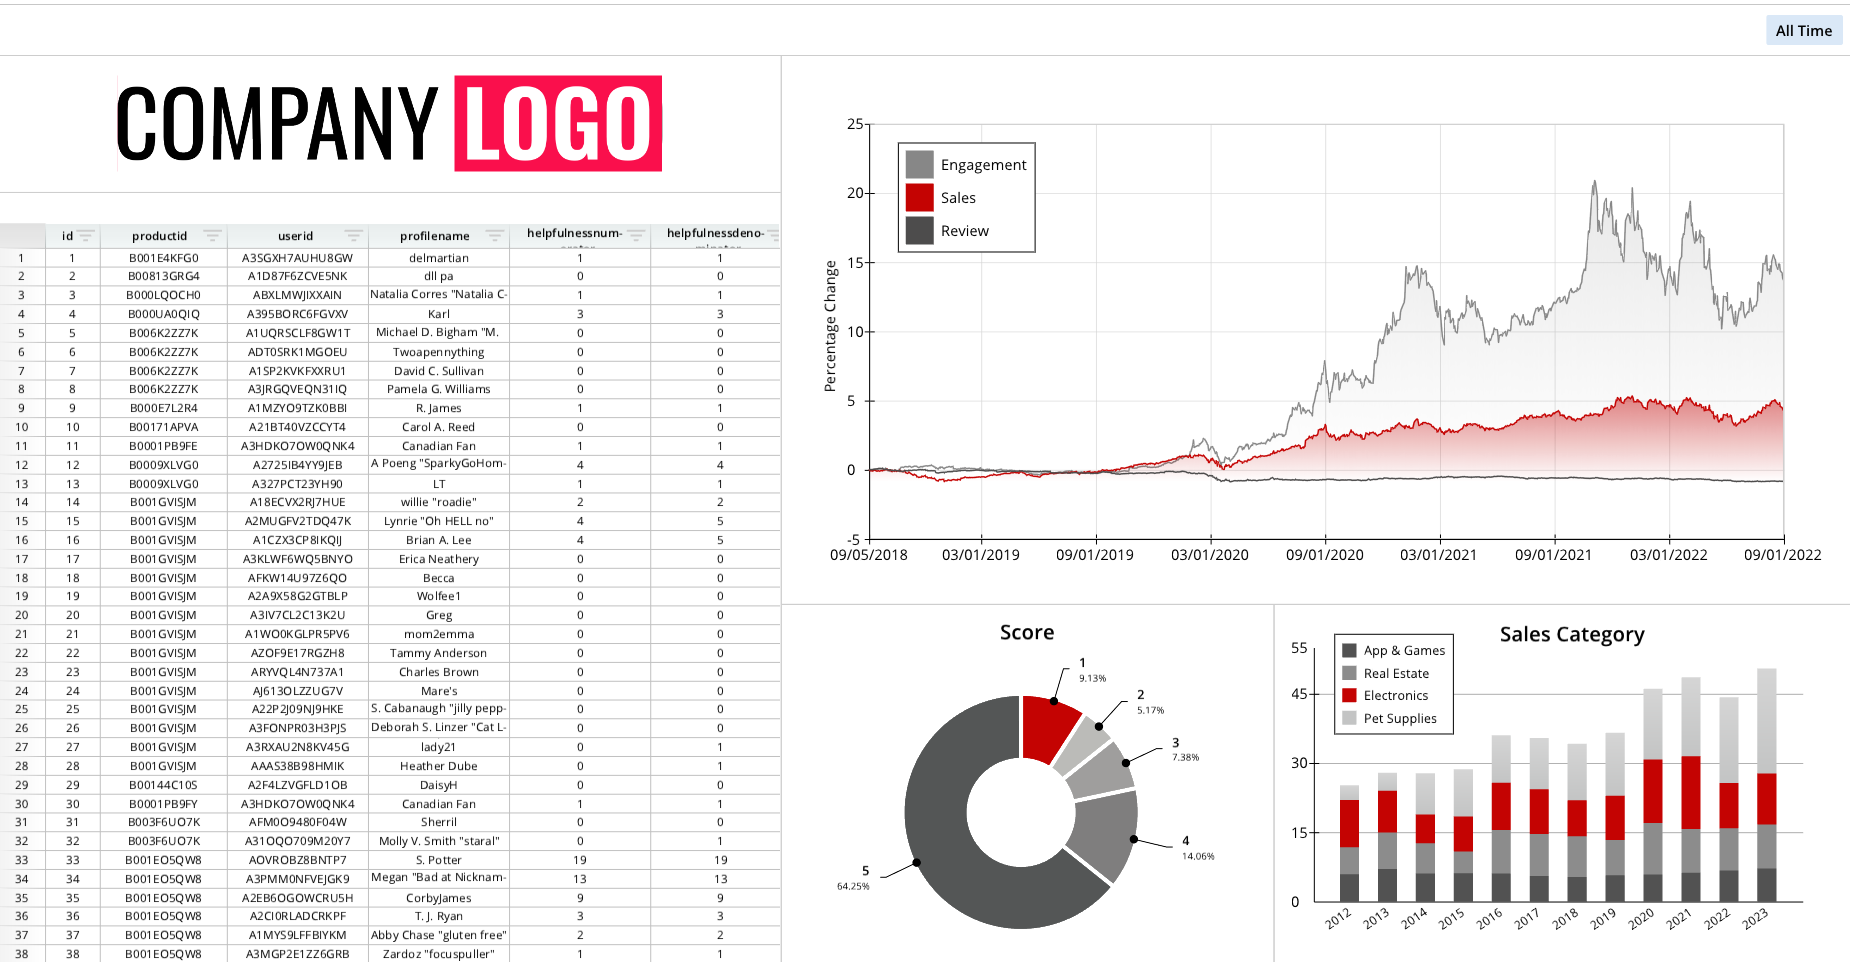
In this example, an existing dashboard is modified to split a pane and add an image to the new pane. This existing dashboard is pulled from the /var/www/dashboards/examples/ directory, which contains many pre-loaded example dashboards. (The example dashboard files are loaded when installing Row64 Server and running the Ubuntu_Connect.py script).
This example uses the Amazon (amazon.dash) example. This dashboard is locally available at:
/var/www/dashboards/examples/amazon.dash
and accessible from a browser at:
http://localhost/dash/examples/amazon
This dashboard initially resembles the following:
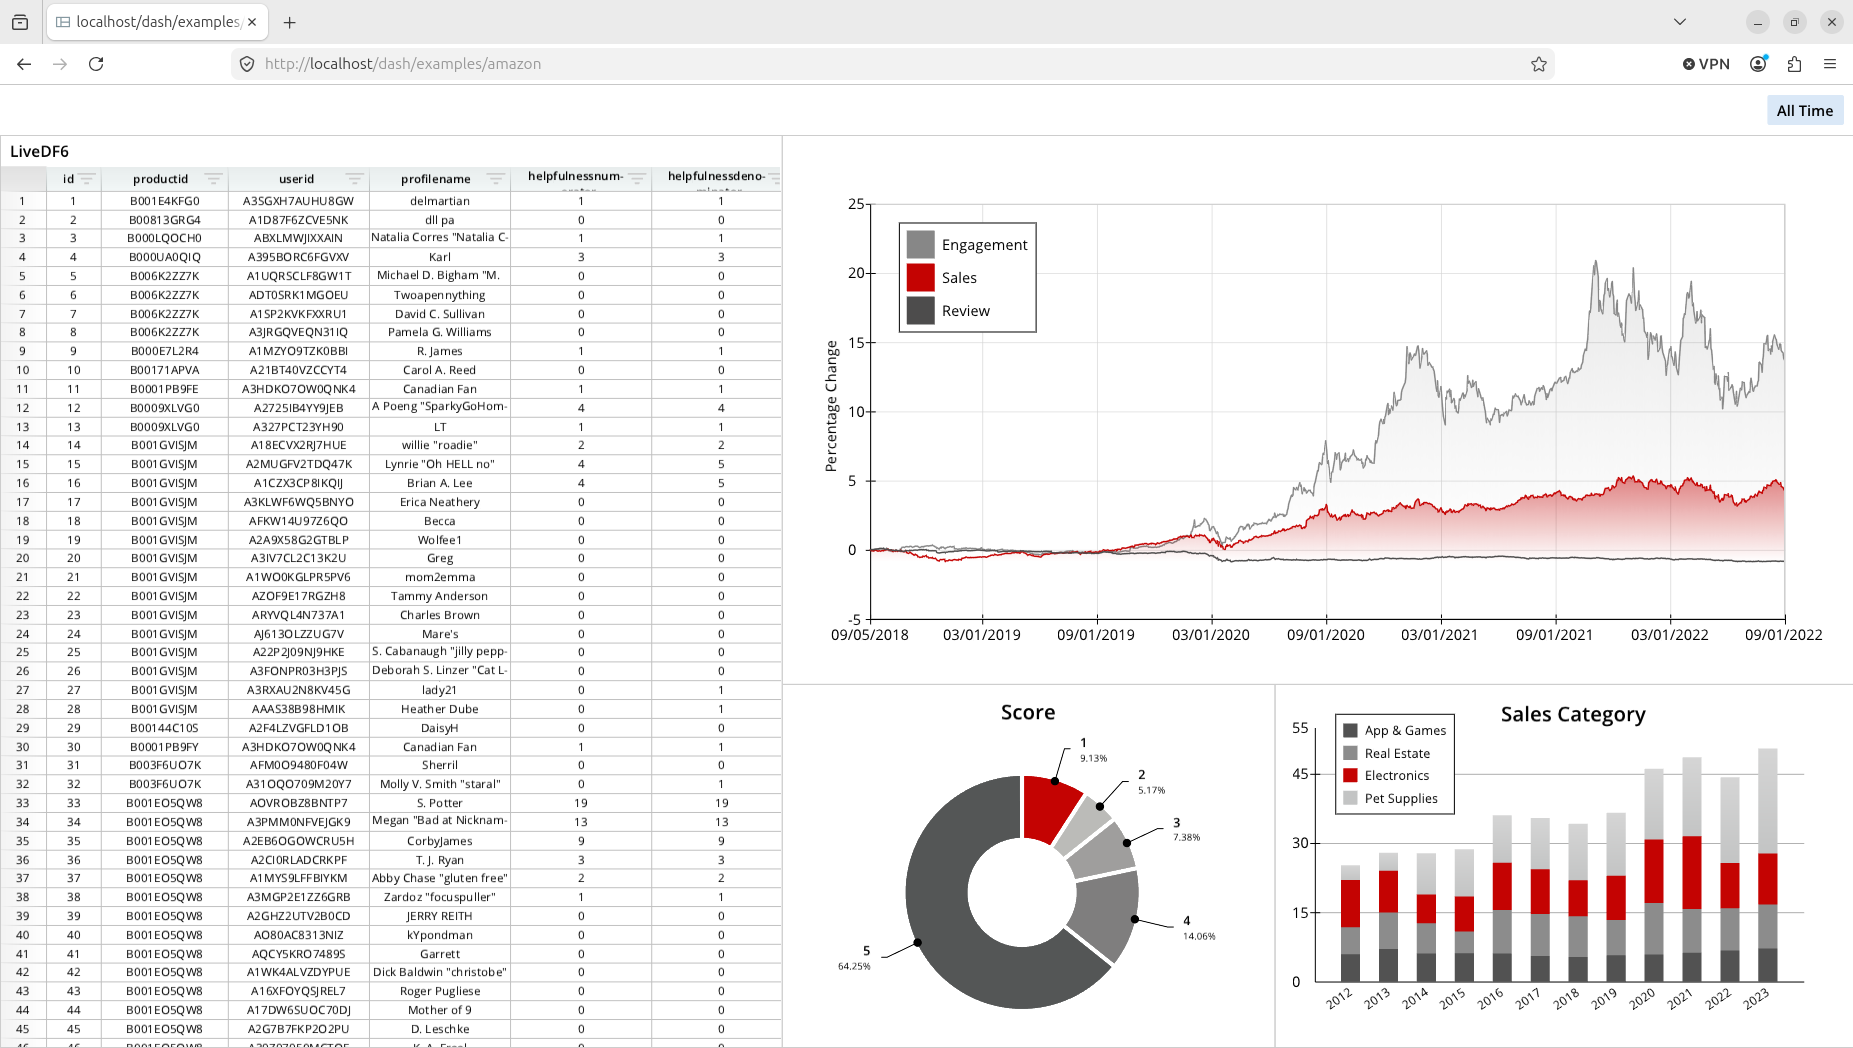
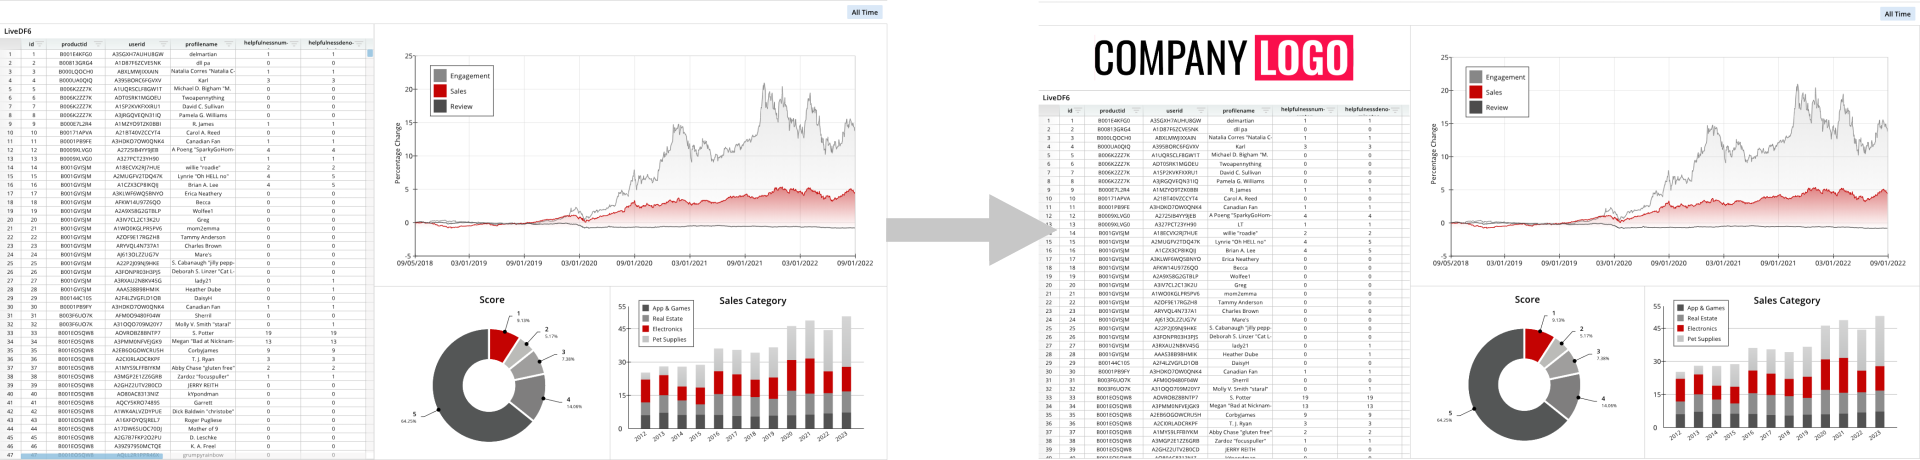
The goal of this example is to add a new pane to the top left area and add a company logo image.
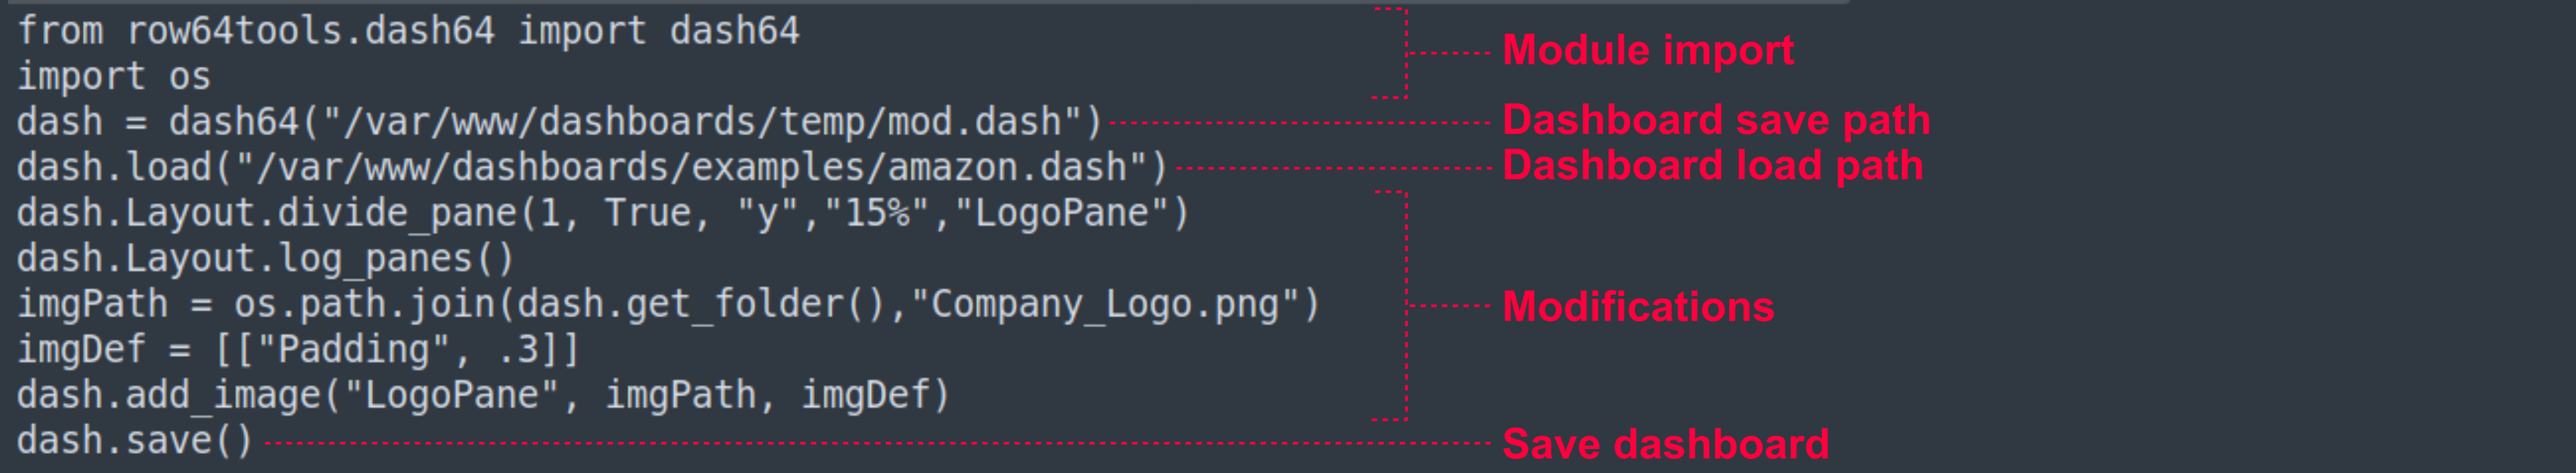
This goal is accomplished with the following modification code:
from row64tools.dash64 import dash64
import os
dash = dash64("/var/www/dashboards/temp/mod.dash")
dash.load("/var/www/dashboards/examples/amazon.dash")
dash.Layout.divide_pane(1, True, "y","15%","LogoPane")
dash.Layout.log_panes()
imgPath = os.path.join(dash.get_folder(),"Company_Logo.png")
imgDef = [["Padding", .3]]
dash.add_image("LogoPane", imgPath, imgDef)
dash.save()
Tip
We generally recommend saving modified dashboard files to a separate location rather than overwriting the original dashboard file. This way, users can revert back to the original dashboard file if needed.
Executing the modification configuration file yeilds the desired outcome, horizontally splitting the left pane and adding an image to that new pane: