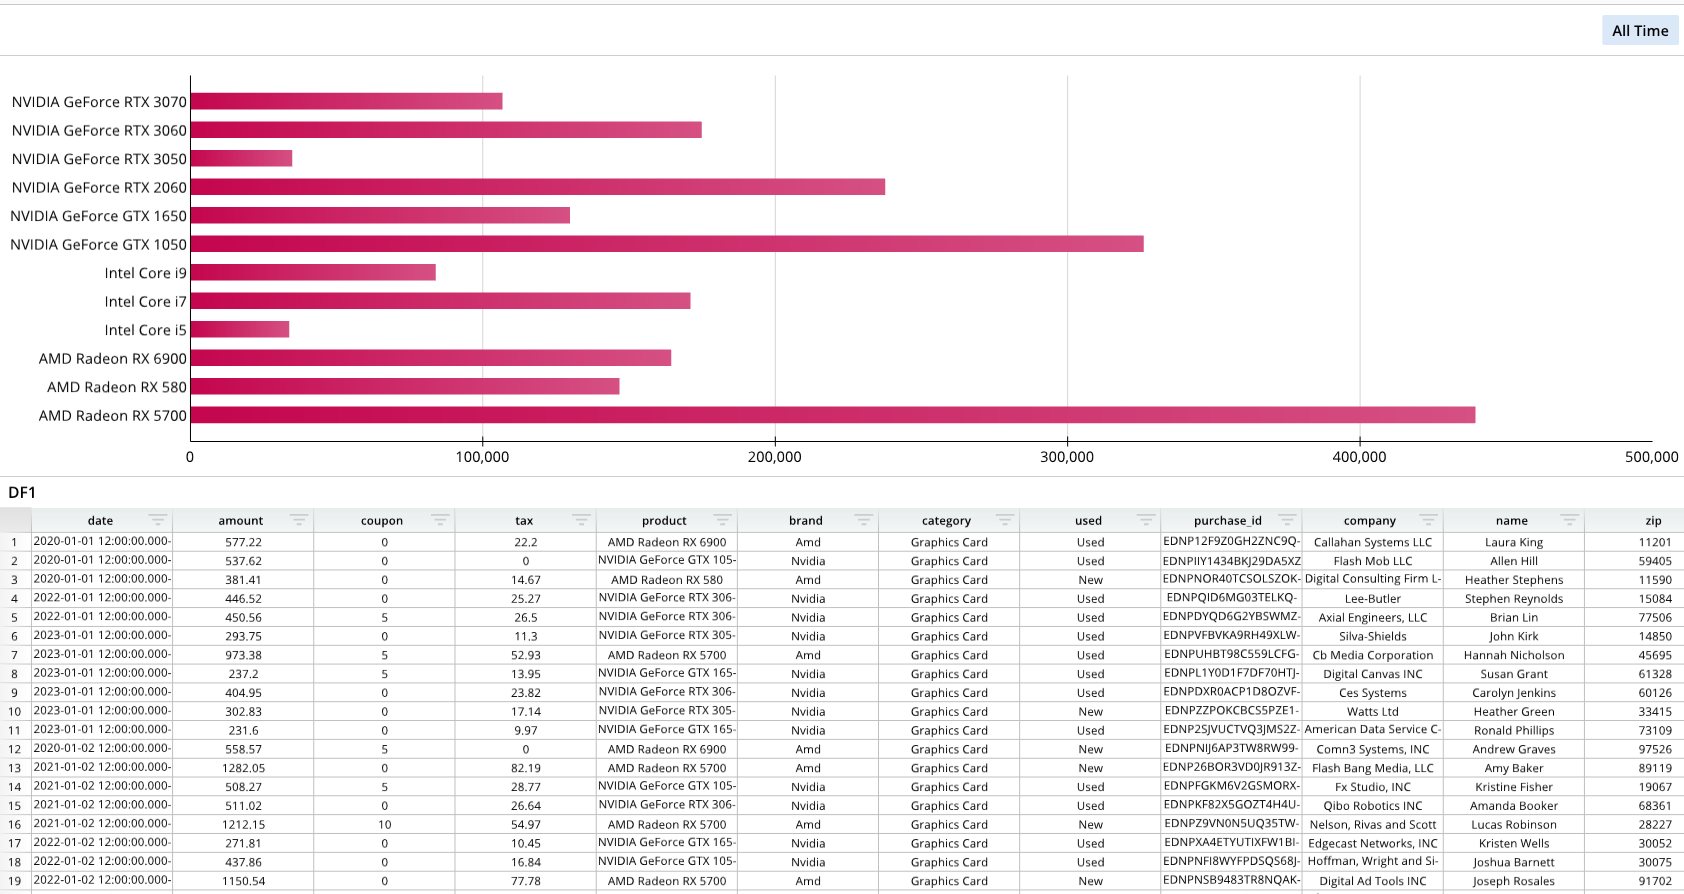
Horizontal Bar Chart
Required Components
Adding a horizontal bar chart requires the following components:
bDef = []- A list that establishes the names, labels, and values on the chart, based on the underlying dataframe or data node.
bOptions = []- A list that formats the appearance of the horizontal bar chart.
- The
bOptions("bar options") list is identical to theformat_optionslist in a regular bar chart; it follows a similar syntax and supports the same options. For a full list of horizontal bar chart formatting, please see Bar Chart - Formatting Options.
dash.add_hbar()- The function that adds the bar chart to a specified pane. This function also takes bDef and bOptions as arguments.
Note that the definition and options lists are simply Python lists and that their variable names can change.
Note
All charts can be based on either dataframes or data nodes. When working with large dataframes, using data nodes to simplify the data may be beneficial, but it is not required.
In this example, the chart is based on a data node, which pulls relevant columns from a larger dataframe.
Components Syntax
bDef
bDef = [[ "SERIES_NAME", "=DATA_NODE!A:A", "=DATA_NODE!B:B" ], ... ]
The bDef list defines the chart's overall structure by stating which columns from the data node are used to form the chart.
"SERIES_NAME"- A name for the series. For example, if you wanted the series' name to be "amount," then this value would simply be
"amount".
- A name for the series. For example, if you wanted the series' name to be "amount," then this value would simply be
"=DNode1!A:A"- The selection from the data table for the x-axis labels.
- In this example, a data node, DNode1, is generated from a data frame, and the data node consists of two columns that are called "amount" and "product". Since A:A is specified for the x-axis labels, the values of the first column, "amount", will be used. Please see the Code Example section for the full example.
"=DNode1!B:B"- The column from the data table to use for defining the chart's values.
- In this example, a data node, DNode1, is generated from a data frame, and the data node consists of two columns that are called "amount" and "product". Since B:B is specified for the x-axis labels, the values of the second column, "product", will be used as the chart's values. Please see the Code Example section for the full example.
bOptions
bOptions = [
    ["Series",0,"Colors",[0xc4064e, 0xc4064e, 0xc4064e, 0xc4064e]]
]
The bOptions list for horizontal bar charts is identical to the format_options list for regular bar charts. Both of these follow the same syntax and support the same options; they only differ in name. Additional formatting list items can be added to bOptions beyond what's displayed in the example. For a syntax overview and a list of all formatting options, please see Bar Chart - Formatting Options.
This specific code example is changing the bar color using the "Series",0,"Colors" series data options, but other options can be used.
"Series"- The type of chart. For example, "Series" can be used to establish a series chart.
0- A numeric value that identifies the series to format. For charts with only one series, use
0. - For example, if a line chart had two series, you would input
0to format the first series, and then1to format the second series.
- A numeric value that identifies the series to format. For charts with only one series, use
"Colors"- An argument for various formatting options. For example, a user could use
"Colors", followed by color values, to change the bar colors.
- An argument for various formatting options. For example, a user could use
dash.add_hbar()
dash.add_hbar("BAR_NAME", "PANE_NAME", bDef, bOptions)
The dash.add_hbar() function adds the bar chart to a dashboard pane and takes the formatting and structuring lists as arguments.
"BAR_NAME"- The name of the bar chart.
"PANE_NAME"- The name of a pane from the pane list (
pList) that the bar chart should be placed on.
- The name of a pane from the pane list (
bDef- The bDef list, which establishes the name, labels, and values.
bOptions- The bOptions list, which determines the formatting.
Code Example
# Module import
from row64tools.dash64 import dash64

# Dashboard save location
dash = dash64("/var/www/dashboards/temp/hbar.dash")

# Establish dashboard panes
pList = [
    ["Dashboard",       "",             "1600",     "900",  "y"],
    ["TopPane",         "Dashboard",    "*",        "*",    ""],
    ["BottomPane",      "Dashboard",    "*",        "50%",  ""]
]
dash.Layout.set_panes(pList)

# Add and format a dataframe
dash.add_ramdb("/var/www/ramdb/live/RAMDB.Row64/Examples/HardwareSales.ramdb","DF1")
dash.add_df("DF1", "BottomPane")

# Add and format a data node
dnDef = [[ "CROSSLINK", ["DF1",1,4], ["df","col","col"] ],
         [ "GROUPSUM",  [1],         ["col"]            ]]
dash.add_datanode("DNode1", "DF1", dnDef)

# Format and add a horizontal bar chart
bDef = [[ "amount", "=DNode1!A:A", "=DNode1!B:B" ] ] # Name, Labels, Values
bOptions = [
    ["Series",0,"Colors",[0xc4064e, 0xc4064e, 0xc4064e, 0xc4064e]]
]

# Add the chart to a pane
dash.add_hbar("Bar1", "TopPane", bDef, bOptions)

# Save the dashboard
dash.save()
Horizontal Line Chart Options
The horizontal line chart shares the same options as a regular line chart. For a full list of options, please refer to Bar Chart - Formatting Options. Note that for formatting options, horizontal bar charts use the bOptions list, whereas regular bar charts use the format_options list. Although these lists differ in name, their syntaxes and options are the same.