Bubble Chart
Required Components
Adding a bubble chart requires the following components:
bDef = []- A list that establishes the series names, labels, and X and Y values, and size values on the chart, based on the underlying dataframe or data node.
bOptions = []- A list of format options that changes the visual appearance of the chart.
dash.add_bubble()- The function that places the chart on a designated pane. The structure and formatting lists are passed into this function.
Note that the definition and options lists are simply Python lists and that their variable names can change.
Components Syntax
bDef
bDef = [ [ "SERIES_NAME", "CHART_LABELS", "X_VALUES", "Y_VALUES", "SIZE_VALUES" ] ]
The bDef ("bubble definition") list establishes the chart's overall structure by defining the series' name, chart labels, x and y values, and the bubble size values.
"SERIES_NAME"- The SERIES_NAME argument is a string value that gives a name to the series.
"CHART_LABELS"- The CHART_LABELS argument defines the labels on the series, which can be a list or cell reference.
"X_VALUES"- The selection from the data table for the x-axis values. This argument is an A1-notation reference to the data source.
- Example:
"=DF1!A:A"
"Y_VALUES"- The selection from the data table for the y-axis values. This argument is an A1-notation reference to the data source.
- Example:
"=DF1!C:C"
"SIZE_VALUES"- The selection from the data table for the bubble sizes. This argument is an A1-notation reference to the data source.
- Example:
"=DF1!C:C"
bOptions
bOptions = [
    ["Format","AxisX","LabelFormat","yyyy-mm-dd"],
    ["Format","GridlineX","PreferZero",False],
    ["Details","Legend","ChipSize",3.2],
    ...
]
The bOptions list is a list of formatting options that changes the appearance of the chart. Each formatting item is enclosed in brackets [ ... ] and separated by commas. A full list of formatting options is available in the Bubble Chart Format Options section.
dash.add_bubble()
dash.add_bubble("CHART_NAME", "PANE_NAME", bDef, bOptions)
The dash.add_bubble() function adds the chart to a designated dashboard pane. This function takes the chart's name, the destination pane's name, and the definition and formatting lists as arguments.
"CHART_NAME"- The name you want to give the chart.
"PANE_NAME"- The name of a pane from the pane list (
pList) that the chart should be placed on. The name provided for this argument should match a pane name from the pane list.
- The name of a pane from the pane list (
bDef- The scatter plot definition list, which defines the chart's labels and values.
bOptions- The scatter plot options list, which defines the chart's visual appearance and formatting.
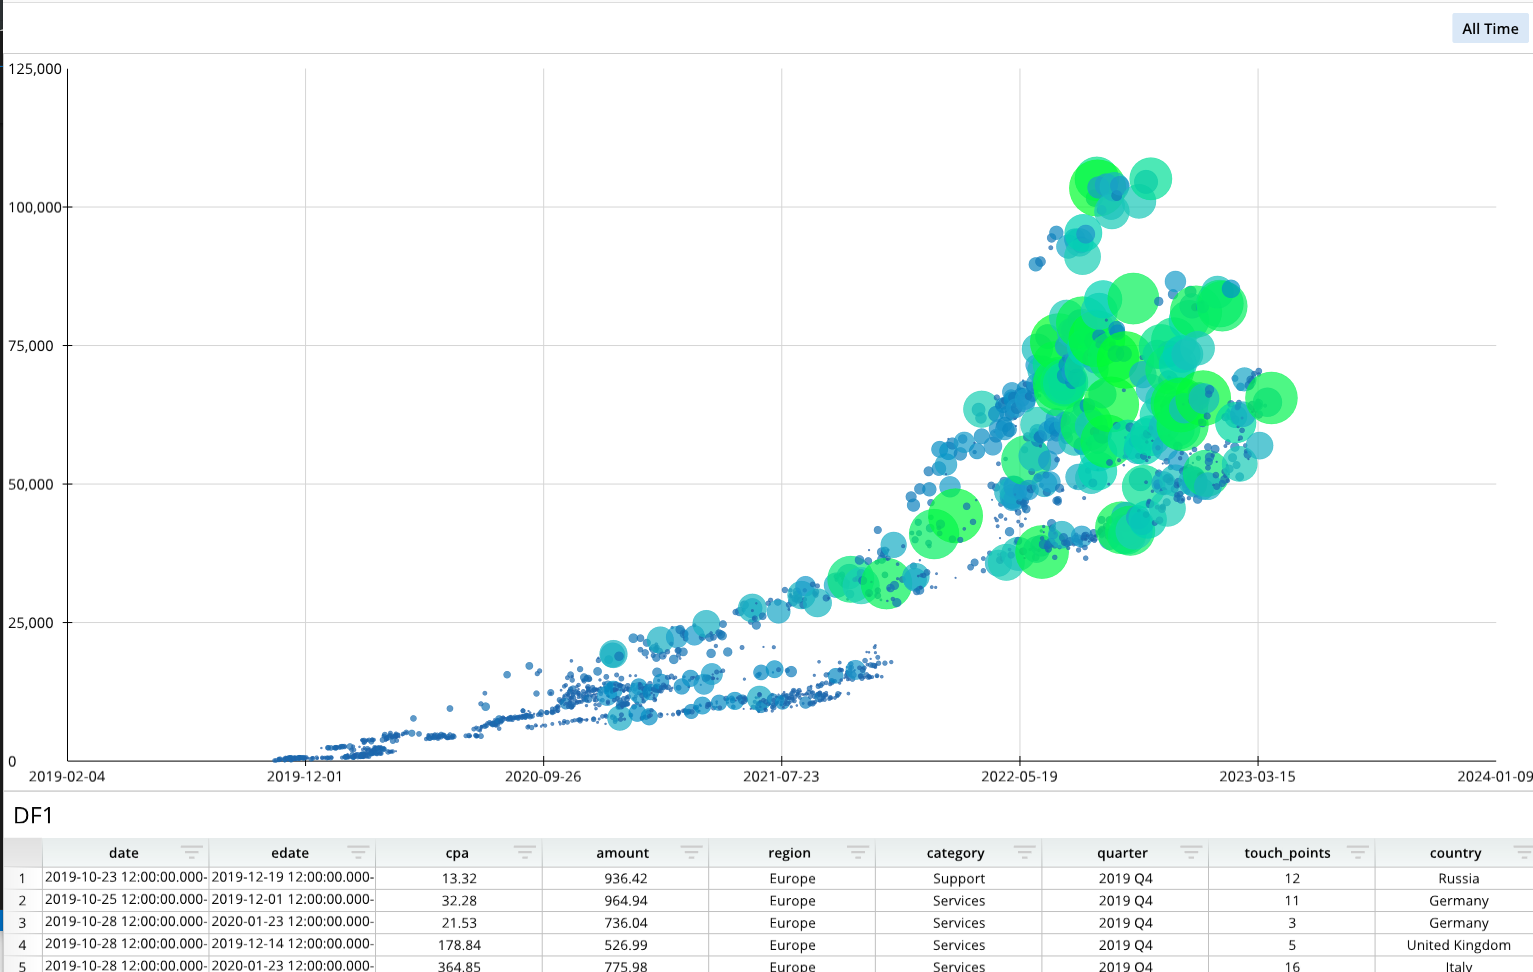
Code Example
# Module import
from row64tools.dash64 import dash64

# Dashboard save location
dash = dash64("/var/www/dashboards/temp/bubble.dash")

# Establish dashboard panes
pList = [
    ["Dashboard",       "",             "1600",     "900",  "y"],
    ["TopPane",         "Dashboard",    "*",        "*",    ""],
    ["BottomPane",      "Dashboard",    "*",        "20%",  ""]
]
dash.Layout.set_panes(pList)

# Add and format a dataframe
dash.add_ramdb("/var/www/ramdb/live/RAMDB.Row64/Examples/CostPerAcquisition.ramdb","DF1")
dash.add_df("DF1", "BottomPane")
paneDef = [ ["Layout","Zoom",1.18] ]
dash.set_pane_def("BottomPane",paneDef)

# Bubble chart definition
bDef = [ [ "Series1", "", "=DF1!A:A", "=DF1!C:C", "=DF1!D:D" ] ] # Name, Labels, X Values, Y Values, Size Values

# Bubble chart formatting
bOptions = [
    ["Format","AxisX","LabelFormat","yyyy-mm-dd"],
    ["Format","GridlineX","PreferZero",False], # bubble chart fit time range: PreferZero = False (don't fit zero in range)
    ["Details","Legend","ChipSize",3.2] # Max bubble size is set by Details > Legend > ChipSize
]

# Add the bubble chart to the dashboard
dash.add_bubble("Bubble1", "TopPane", bDef, bOptions)

# Save the dashboard
dash.save()
Bubble Chart Format Options
The following tables list the available formatting options for bubble charts. To format bubble charts, include formatting items in the bOptions list. Each formatting item should be encapsulated in brackets [ ], and formatting items should be separated by commas. For an example of a bOptions list with multiple formatting items, please see the Code Example above.
General Formatting
| Parameter Keys | Value Type | Example | Description |
|---|---|---|---|
| "Format","Color" | int - hex color | ["Format","Color",0x000000] | Background Color of the Pane |
| "Format","CrossLinking" | bool | ["Format","CrossLinking",False] | False = Disable Cross filtering for this Pane |
| "Format","Pad" | float | ["Format","Pad",.15] | Percentage of Total Height/Width Padding on Pane |
| "Format","LabelShift" | float | ["Format","LabelShift",.3] | Position of Value Labels as a percentage relative to top of bar |
| "Format","DataLabelPos" | int | ["Format","DataLabelPos",3] | Label placement relative to points: 0 = none, 1 = right, 2 = left, 3 = top, 4 = bottom |
| "Format","PrimarySep" | int | ["Format","PrimarySep",3] | Primary Seperator Between Label Parts: 0 = none, 1 = comma, 2 = semicolon, 3 = period, 4 = newline, 5 = space |
| "Format","SecondarySep" | int | ["Format","SecondarySep",3] | Secondary Seperator Between Label Parts: 0 = none, 1 = comma, 2 = semicolon, 3 = period, 4 = newline, 5 = space |
| "Format","LabelTypes" | [int,int,int] | ["Format","LabelTypes",[2,0,0]] | Content of Point Label [primary, secondary1, secondary2] where 0 = none, 1 = label, 2 = value |
| "Format","Reverse" | bool | ["Format","Reverse",True] | Reverses primary & secondary order of Labels |
| "Format","FontAlignment" | [float,float] | ["Format","FontAlignment",[0.5,0.6]] | Alignment of Label Text [x alignment, y alignment] between 0 - 1 |
| "Format","MinChipSize" | float | ["Format","MinChipSize",2.5] | Minimum bubble size (this is a % of the max bubble size, which is given by: "Details","Legend","ChipSize") |
| "Format","PrimaryFont","Size" | float | ["Format","PrimaryFont","Size",25] | Font size of Primary Label |
| "Format","PrimaryFont","Color" | int - hex color | ["Format","PrimaryFont","Color",0xFF000] | Font Color of Primary Label |
| "Format","PrimaryFont","Bold" | bool | ["Format","PrimaryFont","Bold",True] | Font Bold of Primary Label |
| "Format","PrimaryFont","Italic" | bool | ["Format","PrimaryFont","Italic",True] | Font Italic of Primary Label |
| "Format","PrimaryFont","Underline" | bool | ["Format","PrimaryFont","Underline",True] | Font Underline of Primary Label |
| "Format","PrimaryFont","Alpha" | float | ["Format","PrimaryFont","Alpha",.5] | Font Transparency of Primary Label |
| "Format","SecondaryFont","Size" | float | ["Format","SecondaryFont","Size",25] | Font size of Secondary Label |
| "Format","SecondaryFont","Color" | int - hex color | ["Format","SecondaryFont","Color",0xFF000] | Font Color of Secondary Label |
| "Format","SecondaryFont","Bold" | bool | ["Format","SecondaryFont","Bold",True] | Font Bold of Secondary Label |
| "Format","SecondaryFont","Italic" | bool | ["Format","SecondaryFont","Italic",True] | Font Italic of Secondary Label |
| "Format","SecondaryFont","Underline" | bool | ["Format","SecondaryFont","Underline",True] | Font Underline of Secondary Label |
| "Format","SecondaryFont","Alpha" | float | ["Format","SecondaryFont","Alpha",.5] | Font Transparency of Secondary Label |
X Axis
| Parameter Keys | Value Type | Example | Description |
|---|---|---|---|
| "Format","AxisX","ShowAxis" | bool | ["Format","AxisX","ShowAxis",True] | Show the x-Axis on the Bar Chart |
| "Format","AxisX","ShowMajorTicks" | bool | ["Format","AxisX","ShowMajorTicks",True] | Show Major Ticks on the x-axis |
| "Format","AxisX","ShowMinorTicks" | bool | ["Format","AxisX","ShowMinorTicks",True] | Show Minor Ticks on the x-axis |
| "Format","AxisX","ShowEndTicks" | bool | ["Format","AxisX","ShowEndTicks",True] | Put Ticks on the end of the x-axis |
| "Format","AxisX","ShowEndLabels" | bool | ["Format","AxisX","ShowEndLabels",True] | Show End Lables on x-axis |
| "Format","AxisX","TickShift" | bool | ["Format","AxisX","TickShift",.7] | Shift Ticks: 0 = center, < 0 = shift out (left or down), > 0 = shift in (right or up) |
| "Format","AxisX","TickSize" | bool | ["Format","AxisX","TickSize",1.7] | Size of Tick in Pixels |
| "Format","AxisX","Line","Color" | int - hex color | ["Format","AxisX","Line","Color",0xFF000] | Line color on the x-axis |
| "Format","AxisX","Line","Size" | float | ["Format","AxisX","Line","Size",2.1] | Line size / thickness on the x-axis |
| "Format","AxisX","Line","Alpha" | float | ["Format","AxisX","Line","Alpha",.5] | Line transparency on the x-axis, between 0-1 |
| "Format","AxisX","ShowLabels" | bool | ["Format","AxisX","ShowLabels",True] | Show Labels on x-axis |
| "Format","AxisX","LabelFont","Size" | float | ["Format","AxisX","LabelFont","Size",25] | Font size on x-axis Labels |
| "Format","AxisX","LabelFont","Color" | int - hex color | ["Format","AxisX","LabelFont","Color",0xFF000] | Font Color on x-axis Labels |
| "Format","AxisX","LabelFont","Bold" | bool | ["Format","AxisX","LabelFont","Bold",True] | Font Bold on x-axis Labels |
| "Format","AxisX","LabelFont","Italic" | bool | ["Format","AxisX","LabelFont","Italic",True] | Font Italic on x-axis Labels |
| "Format","AxisX","LabelFont","Underline" | bool | ["Format","AxisX","LabelFont","Underline",True] | Font Underline on x-axis Labels |
| "Format","AxisX","LabelFont","Alpha" | float | ["Format","AxisX","LabelFont","Alpha",.5] | Font Transparency on x-axis Labels |
| "Format","AxisX","LabelShift" | float | ["Format","AxisX","LabelShift",.5] | Shift Labels Perpedicular To Line: 0 = base, < 0 = shift out (left or down), > 0 = shift in (right or up) |
| "Format","AxisX","LabelFormat" | string | ["Format","AxisX","LabelFormat","#,##0"] | Labels Number Format Code (ex: decimal places, commas, dollar sign, etc) |
| "Format","AxisX","LabelAlign" | float | ["Format","AxisX","LabelAlign",.1] | Shift Labels Parallel To Line: 0 = center, < 0 = align bottom (or left), > 0 align top (or right) |
| "Format","AxisX","LabelRotation" | float | ["Format","AxisX","LabelRotation",.5] | Labels Rotation In Radians: 0 = no rotation, 1 = 90 degrees clockwise, -1 = 90 degrees counter-clockwise |
| "Format","AxisX","ShowTitle" | bool | ["Format","AxisX","ShowTitle",True] | Show x-axis Title |
| "Format","AxisX","Title" | string | ["Format","AxisX","Title","Title Text Here"] | Title Text on x-axis |
| "Format","AxisX","TitleFont","Size" | float | ["Format","AxisX","TitleFont","Size",25] | Font size on x-axis Title |
| "Format","AxisX","TitleFont","Color" | int - hex color | ["Format","AxisX","TitleFont","Color",0xFF000] | Font Color on x-axis Title |
| "Format","AxisX","TitleFont","Bold" | bool | ["Format","AxisX","TitleFont","Bold",True] | Font Bold on x-axis Title |
| "Format","AxisX","TitleFont","Italic" | bool | ["Format","AxisX","TitleFont","Italic",True] | Font Italic on x-axis Title |
| "Format","AxisX","TitleFont","Underline" | bool | ["Format","AxisX","TitleFont","Underline",True] | Font Underline on x-axis Title |
| "Format","AxisX","TitleFont","Alpha" | float | ["Format","AxisX","TitleFont","Alpha",.5] | Font Transparency on x-axis Title |
| "Format","AxisX","TitlePos" | [float,float] | ["Format","AxisX","TitlePos",[0.5,0.5]] | X-Axis Title x,y as a percentage of Pane Height/Width |
Y Axis
| Parameter Keys | Value Type | Example | Description |
|---|---|---|---|
| "Format","AxisY","ShowAxis" | bool | ["Format","AxisY","ShowAxis",True] | Show the y-Axis on the Bar Chart |
| "Format","AxisY","ShowMajorTicks" | bool | ["Format","AxisY","ShowMajorTicks",True] | Show Major Ticks on the y-Axis |
| "Format","AxisY","ShowMinorTicks" | bool | ["Format","AxisY","ShowMinorTicks",True] | Show Minor Ticks on the y-Axis |
| "Format","AxisY","ShowEndTicks" | bool | ["Format","AxisY","ShowEndTicks",True] | Put Ticks on the end of the y-Axis |
| "Format","AxisY","ShowEndLabels" | bool | ["Format","AxisY","ShowEndLabels",True] | Show End Lables on y-Axis |
| "Format","AxisY","TickShift" | bool | ["Format","AxisY","TickShift",.7] | Shift Ticks: 0 = center, < 0 = shift out (left or down), > 0 = shift in (right or up) |
| "Format","AxisY","TickSize" | bool | ["Format","AxisY","TickSize",1.7] | Size of Tick in Pixels |
| "Format","AxisY","Line","Color" | int - hex color | ["Format","AxisY","Line","Color",0xFF000] | Line color on the y-Axis |
| "Format","AxisY","Line","Size" | float | ["Format","AxisY","Line","Size",2.1] | Line size / thickness on the y-Axis |
| "Format","AxisY","Line","Alpha" | float | ["Format","AxisY","Line","Alpha",.5] | Line transparency on the y-Axis, between 0-1 |
| "Format","AxisY","ShowLabels" | bool | ["Format","AxisY","ShowLabels",True] | Show Labels on y-Axis |
| "Format","AxisY","LabelFont","Size" | float | ["Format","AxisY","LabelFont","Size",25] | Font size on y-Axis Labels |
| "Format","AxisY","LabelFont","Color" | int - hex color | ["Format","AxisY","LabelFont","Color",0xFF000] | Font Color on y-Axis Labels |
| "Format","AxisY","LabelFont","Bold" | bool | ["Format","AxisY","LabelFont","Bold",True] | Font Bold on y-Axis Labels |
| "Format","AxisY","LabelFont","Italic" | bool | ["Format","AxisY","LabelFont","Italic",True] | Font Italic on y-Axis Labels |
| "Format","AxisY","LabelFont","Underline" | bool | ["Format","AxisY","LabelFont","Underline",True] | Font Underline on y-Axis Labels |
| "Format","AxisY","LabelFont","Alpha" | float | ["Format","AxisY","LabelFont","Alpha",.5] | Font Transparency on y-Axis Labels |
| "Format","AxisY","LabelShift" | float | ["Format","AxisY","LabelShift",.5] | Shift Labels Perpedicular To Line: 0 = base, < 0 = shift out (left or down), > 0 = shift in (right or up) |
| "Format","AxisY","LabelFormat" | string | ["Format","AxisY","LabelFormat","#,##0"] | Labels Number Format Code (ex: decimal places, commas, dollar sign, etc) |
| "Format","AxisY","LabelAlign" | float | ["Format","AxisY","LabelAlign",.1] | Shift Labels Parallel To Line: 0 = center, < 0 = align bottom (or left), > 0 align top (or right) |
| "Format","AxisY","LabelRotation" | float | ["Format","AxisY","LabelRotation",.5] | Labels Rotation In Radians: 0 = no rotation, 1 = 90 degrees clockwise, -1 = 90 degrees counter-clockwise |
| "Format","AxisY","ShowTitle" | bool | ["Format","AxisY","ShowTitle",True] | Show y-Axis Title |
| "Format","AxisY","Title" | string | ["Format","AxisY","Title","Title Text Here"] | Title Text on y-Axis |
| "Format","AxisY","TitleFont","Size" | float | ["Format","AxisY","TitleFont","Size",25] | Font size on y-Axis Title |
| "Format","AxisY","TitleFont","Color" | int - hex color | ["Format","AxisY","TitleFont","Color",0xFF000] | Font Color on y-Axis Title |
| "Format","AxisY","TitleFont","Bold" | bool | ["Format","AxisY","TitleFont","Bold",True] | Font Bold on y-Axis Title |
| "Format","AxisY","TitleFont","Italic" | bool | ["Format","AxisY","TitleFont","Italic",True] | Font Italic on y-Axis Title |
| "Format","AxisY","TitleFont","Underline" | bool | ["Format","AxisY","TitleFont","Underline",True] | Font Underline on y-Axis Title |
| "Format","AxisY","TitleFont","Alpha" | float | ["Format","AxisY","TitleFont","Alpha",.5] | Font Transparency on y-Axis Title |
| "Format","AxisY","TitlePos" | [float,float] | ["Format","AxisY","TitlePos",[0.5,0.5]] | y-Axis Title x,y as a percentage of Pane Height/Width |
X Grid
| Parameter Keys | Value Type | Example | Description |
|---|---|---|---|
| "Format","GridlineX","Type" | int | ["Format","GridlineX","Type",1] | X Grid Type: 0=grid_categorical, 1=grid_numeric, 2=grid_datetime |
| "Format","GridlineX","ShowMajor" | bool | ["Format","GridlineX","ShowMajor",True] | Show Major gridlines on X Grid |
| "Format","GridlineX","ShowMinor" | bool | ["Format","GridlineX","ShowMinor",True] | Show Minor gridlines on X Grid |
| "Format","GridlineX","MajorUnit" | float | ["Format","GridlineX","MajorUnit",1.0] | Major Unit on X Grid |
| "Format","GridlineX","MinorUnit" | float | ["Format","GridlineX","MinorUnit",1.0] | Minor Unit on X Grid |
| "Format","GridlineX","AutoMajor" | bool | ["Format","GridlineX","AutoMajor",True] | Automatically Determine Major Unit on X Grid, sets the MajorBase, MajorUnit, and the MajorStart |
| "Format","GridlineX","AutoMinor" | bool | ["Format","GridlineX","AutoMinor",True] | Automatically Determine Minor Unit on X Grid, sets the MinorBase & MinorUnit |
| "Format","GridlineX","MinBound" | float | ["Format","GridlineX","MinBound",10] | Minimum Value For Range Of X Grid (only used if AutoMin Is Off) |
| "Format","GridlineX","MaxBound" | float | ["Format","GridlineX","MaxBound",10] | Maximum Value For Range Of X Grid (only used if AutoMax Is Off) |
| "Format","GridlineX","AutoMin" | bool | ["Format","GridlineX","AutoMin", True] | Automatically Determine MinBound on X Grid |
| "Format","GridlineX","AutoMax" | bool | ["Format","GridlineX","AutoMax", True] | Automatically Determine MaxBound on X Grid |
| "Format","GridlineX","PreferZero" | bool | ["Format","GridlineX","PreferZero", False] | Include 0 in the Range of The X Grid |
| "Format","GridlineX","MajorLine","Color" | int - hex color | ["Format","GridlineX","MajorLine","Color",0xFF000] | Line color on the x-Grid |
| "Format","GridlineX","MajorLine","Size" | float | ["Format","GridlineX","MajorLine","Size",2.1] | Line size / thickness on the x-Grid |
| "Format","GridlineX","MajorLine","Alpha" | float | ["Format","GridlineX","MajorLine","Alpha",.5] | Line transparency on the x-Grid, between 0-1 |
| "Format","GridlineX","GridBase" | int | ["Format","GridlineX","GridBase", 68] | ASCII char value for datetime span divisions: 0 = not set, 68 = 'D' day, 77 = 'M' month, 89 = 'Y' year |
| "Format","GridlineX","MajorBase" | int | ["Format","GridlineX","MajorBase", 68] | ASCII char value for datetime span divisions: 0 = not set, 68 = 'D' day, 77 = 'M' month, 89 = 'Y' year |
| "Format","GridlineX","MinorBase" | int | ["Format","GridlineX","MinorBase", 68] | ASCII char value for datetime span divisions: 0 = not set, 68 = 'D' day, 77 = 'M' month, 89 = 'Y' year |
| "Format","GridlineX","MajorStart" | float | ["Format","GridlineX","MajorStart", 10] | Start Value For The x-Grid |
Y Grid
| Parameter Keys | Value Type | Example | Description |
|---|---|---|---|
| "Format","GridlineY","Type" | int | ["Format","GridlineY","Type",1] | Y Grid Type: 0=grid_categorical, 1=grid_numeric, 2=grid_datetime |
| "Format","GridlineY","ShowMajor" | bool | ["Format","GridlineY","ShowMajor",True] | Show Major gridlines on Y Grid |
| "Format","GridlineY","ShowMinor" | bool | ["Format","GridlineY","ShowMinor",True] | Show Minor gridlines on Y Grid |
| "Format","GridlineY","MajorUnit" | float | ["Format","GridlineY","MajorUnit",1.0] | Major Unit on Y Grid |
| "Format","GridlineY","MinorUnit" | float | ["Format","GridlineY","MinorUnit",1.0] | Minor Unit on Y Grid |
| "Format","GridlineY","AutoMajor" | bool | ["Format","GridlineY","AutoMajor",True] | Automatically Determine Major Unit on Y Grid, sets the MajorBase, MajorUnit, and the MajorStart |
| "Format","GridlineY","AutoMinor" | bool | ["Format","GridlineY","AutoMinor",True] | Automatically Determine Minor Unit on Y Grid, sets the MinorBase & MinorUnit |
| "Format","GridlineY","MinBound" | float | ["Format","GridlineY","MinBound",10] | Minimum Value For Range Of Y Grid (only used if AutoMin Is Off) |
| "Format","GridlineY","MaxBound" | float | ["Format","GridlineY","MaxBound",10] | Maximum Value For Range Of Y Grid (only used if AutoMax Is Off) |
| "Format","GridlineY","AutoMin" | bool | ["Format","GridlineY","AutoMin", True] | Automatically Determine MinBound on Y Grid |
| "Format","GridlineY","AutoMax" | bool | ["Format","GridlineY","AutoMax", True] | Automatically Determine MaxBound on Y Grid |
| "Format","GridlineY","PreferZero" | bool | ["Format","GridlineY","PreferZero", False] | Include 0 in the Range of The Y Grid |
| "Format","GridlineY","MajorLine","Color" | int - hex color | ["Format","GridlineY","MajorLine","Color",0xFF000] | Line color on the y-Grid |
| "Format","GridlineY","MajorLine","Size" | float | ["Format","GridlineY","MajorLine","Size",2.1] | Line size / thickness on the y-Grid |
| "Format","GridlineY","MajorLine","Alpha" | float | ["Format","GridlineY","MajorLine","Alpha",.5] | Line transparency on the y-Grid, between 0-1 |
| "Format","GridlineY","GridBase" | int | ["Format","GridlineY","GridBase", 68] | ASCII char value for datetime span divisions: 0 = not set, 68 = 'D' day, 77 = 'M' month, 89 = 'Y' year |
| "Format","GridlineY","MajorBase" | int | ["Format","GridlineY","MajorBase", 68] | ASCII char value for datetime span divisions: 0 = not set, 68 = 'D' day, 77 = 'M' month, 89 = 'Y' year |
| "Format","GridlineY","MinorBase" | int | ["Format","GridlineY","MinorBase", 68] | ASCII char value for datetime span divisions: 0 = not set, 68 = 'D' day, 77 = 'M' month, 89 = 'Y' year |
| "Format","GridlineY","MajorStart" | float | ["Format","GridlineY","MajorStart", 10] | Start Value For The y-Grid |
Series Data
(Second value is series index)
| Parameter Keys | Value Type | Example | Description |
|---|---|---|---|
| "Series",0,"Name" | string | ["Series",0,"Name","Enter Series Name"] | Name of the series |
| "Series",0,"Labels" | string | ["Series",0,"Labels","=DF1!B:B"] | Lables on the series (list or cell reference like Excel). Ex: '={"Label_01","Label_02","Label_03"}' |
| "Series",0,"XValues" | string | ["Series",0,"XValues","=DF1!A:A"] | Cell reference of the x values in the series (list or cell reference like Excel). Ex: '={1,3,2.95}' |
| "Series",0,"YValues" | string | ["Series",0,"YValues","=DF1!C:C"] | Cell reference of the y values in the series (list or cell reference like Excel). Ex: '={1,3,2.95}' |
| "Series",0,"ZValues" | string | ["Series",0,"ZValues","=DF1!D:D"] | Cell reference of the z values in the series (bubble size & color) |
| "Series",0,"ColorTheme" | [int,int,int,int] | ["Series",0,"ColorTheme",[0xFF5ea7, 0xFF99cb, 0x44d6b2, 0x77ff2b]] | Color Theme of this Series in the Bubble Chart |
| "Series",0,"EQOptions","ShowEq" | bool | ["Series",0,"EQOptions","ShowEq",True] | Show Equation |
| "Series",0,"EQOptions","ShowR" | bool | ["Series",0,"EQOptions","ShowR", True] | Show Regression Line |
| "Series",0,"EQOptions","ShowTrendline" | bool | ["Series",0,"EQOptions","ShowTrendline", True] | ShowTrendline |
| "Series",0,"EQOptions","Loc" | [float,float] | ["Series",0,"EQOptions","Loc",[0.25,0.75]] | Equation position x,y as a percentage of Pane Height/Width |
| "Series",0,"EQOptions","RegressionL","Color" | int - hex color | ["Series",0,"EQOptions","RegressionL","Color",0xFF000] | Line color of Regression Line |
| "Series",0,"EQOptions","RegressionL","Size" | float | ["Series",0,"EQOptions","RegressionL","Size",2.1] | Line size / thickness of Regression Line |
| "Series",0,"EQOptions","RegressionL","Alpha" | float | ["Series",0,"EQOptions","RegressionL","Alpha",.5] | Line transparency of Regression Line, between 0-1 |
| "Series",0,"EQOptions","EquationF","Size" | float | ["Series",0,"EQOptions","EquationF","Size",25] | Font size on y-Axis Title |
| "Series",0,"EQOptions","EquationF","Color" | int - hex color | ["Series",0,"EQOptions","EquationF","Color",0xFF000] | Font Color on y-Axis Title |
| "Series",0,"EQOptions","EquationF","Bold" | bool | ["Series",0,"EQOptions","EquationF","Bold",True] | Font Bold on y-Axis Title |
| "Series",0,"EQOptions","EquationF","Italic" | bool | ["Series",0,"EQOptions","EquationF","Italic",True] | Font Italic on y-Axis Title |
| "Series",0,"EQOptions","EquationF","Underline" | bool | ["Series",0,"EQOptions","EquationF","Underline",True] | Font Underline on y-Axis Title |
| "Series",0,"EQOptions","EquationF","Alpha" | float | ["Series",0,"EQOptions","EquationF","Alpha",.5] | Font Transparency on y-Axis Title |
| "Series",0,"Marker","Shape" | int | ["Series",0,"Marker","Shape",1] | Marker Shape placed on Line Points: 0=None, 1=circle, 2=square, 3=triangle |
| "Series",0,"Marker","Size" | float | ["Series",0,"Marker","Size",10.0] | Marker Size placed on Line Points in pixels |
| "Series",0,"Marker","Alpha" | float | ["Series",0,"Marker","Alpha",.5] | Marker Transparency |
| "Series",0,"Marker","Color" | int - hex color | ["Series",0,"Marker","Color",0xFF000] | Marker Color |
| "Series",0,"Marker","HasFill" | bool | ["Series",0,"Marker","HasFill",True] | Marker Is Filled In |
| "Series",0,"HasLine" | bool | ["Series",0,"HasLine",True] | Line Connecting Scatter Points is Visible |
| "Series",0,"Line","Color" | int - hex color | ["Series",0,"Line","Color",0xFF000] | Line Color |
| "Series",0,"Line","Size" | float | ["Series",0,"Line","Size",2.1] | Line Size / thickness |
| "Series",0,"Line","Alpha" | float | ["Series",0,"Line","Alpha",.5] | Line Transparency |
| "Series",0,"FillType" | int | ["Series",0,"FillType",True] | Line Fill: 0=None, 1=Solid Fill, 2=Gradient |
| Series,0,"Fill","Color" | int - hex color | ["Series",0,"Fill","Color",0xFF000] | Fill Color Below Line |
| Series,0,"Fill","Alpha" | float | ["Series",0,"Fill","Alpha",.5] | Fill Transparency Below Line |
Details
| Parameter Keys | Value Type | Example | Description |
|---|---|---|---|
| "Details","ShowTitle" | bool | ["Details","ShowTitle",True] | Show Chart Title |
| "Details","Title" | string | ["Details","Title","Enter Chart Title"] | String of Chart Title |
| "Details","GroupType" | int | ["Details","GroupType",1] | 0 = Series Not Grouped, 1 = Series are Grouped |
| "Details","TitleFont","Size" | float | ["Details","TitleFont","Size",25] | Font size of Title (if ShowTitle is True) |
| "Details","TitleFont","Color" | int - hex color | ["Details","TitleFont","Color",0xFF000] | Font Color of Title (if ShowTitle is True) |
| "Details","TitleFont","Bold" | bool | ["Details","TitleFont","Bold",True] | Font Bold of Title (if ShowTitle is True) |
| "Details","TitleFont","Italic" | bool | ["Details","TitleFont","Italic",True] | Font Italic of Title (if ShowTitle is True) |
| "Details","TitleFont","Underline" | bool | ["Details","TitleFont","Underline",True] | Font Underline of Title (if ShowTitle is True) |
| "Details","TitleFont","Alpha" | float | ["Details","TitleFont","Alpha",.5] | Font Transparency of Title (if ShowTitle is True) |
| "Details","TitlePos" | [float,float] | ["Details","TitlePos",[.5,.05]] | Chart Title x,y as a percentage of Pane Height/Width |
| "Details","Gaps" | [float,float] | ["Details","Gaps",[.46,.27]] | Major Gap between Bar Chart series, followed by Minor Gap between bars |
| "Details","Legend","Show" | bool | ["Details","Legend","Show",True] | Show Chart Legend |
| "Details","Legend","Pos" | [float,float] | ["Details","Legend","Pos", [0.755, 0.15]] | Chart Legend x,y as a percentage of dimensions |
| "Details","Legend","Dim" | [float,float] | ["Details","Legend","Dim", [100.0, 100.0]] | Chart Legend w,y dimensions in pixels |
| "Details","Legend","HasBorder" | bool | ["Details","Legend","HasBorder",True] | Chart Legend Border is Visible |
| "Details","Legend","Border","Color" | int - hex color | ["Details","Legend","Border","Color",0xFF000] | Line color of Legend Border |
| "Details","Legend","Border","Size" | float | ["Details","Legend","Border","Size",2.1] | Line size / thickness of Legend Border |
| "Details","Legend","Border","Alpha" | float | ["Details","Legend","Border","Alpha",.5] | Line transparency of Legend Border |
| "Details","Legend","HasFill" | bool | ["Details","Legend","HasFill", True] | Chart Legend is Filled |
| "Details","Legend","Fill","Color" | int - hex color | ["Details","Legend","Fill","Color",0xFF000] | Fill Color of Legend |
| "Details","Legend","Fill","Alpha" | float | ["Details","Legend","Fill","Alpha",.5] | Transparency of Legend Fill |
| "Details","Legend","Font","Size" | float | ["Details","Legend","Font","Size",25] | Font size of Legend |
| "Details","Legend","Font","Color" | int - hex color | ["Details","Legend","Font","Color",0xFF000] | Font Color of Legend |
| "Details","Legend","Font","Bold" | bool | ["Details","Legend","Font","Bold",True] | Font Bold of Legend |
| "Details","Legend","Font","Italic" | bool | ["Details","Legend","Font","Italic",True] | Font Italic of Legend |
| "Details","Legend","Font","Underline" | bool | ["Details","Legend","Font","Underline",True] | Font Underline of Legend |
| "Details","Legend","Font","Alpha" | float | ["Details","Legend","Font","Alpha",.5] | Font Transparency of Legend |
| "Details","Legend","ChipSize" | float | ["Details","Legend","ChipSize",7.0] | Legend Chip Size |
| "Details","Legend","ChipSpacing" | float | ["Details","Legend","ChipSpacing",5.0] | Legend Spacing Between Chips |
| "Details","Layout","RPadding" | float | ["Details","Layout","RPadding",10.0] | Chart Right Padding Inset In Addition To Pane Padding |
| "Details","Layout","LPadding" | float | ["Details","Layout","LPadding",10.0] | Chart Left Padding Inset In Addition To Pane Padding |
| "Details","Layout","TPadding" | float | ["Details","Layout","TPadding",10.0] | Chart Top Padding Inset In Addition To Pane Padding |
| "Details","Layout","BPadding" | float | ["Details","Layout","BPadding",10.0] | Chart Bottom Padding Inset In Addition To Pane Padding |
| "Details","Layout","HasChartBorder" | bool | ["Details","Layout","HasChartBorder",True] | Chart Border Around Chart Area (Does Not Include Label Area) |
| "Details","Layout","ChartBorder","Color" | int - hex color | ["Details","Layout","ChartBorder","Color",0xFF000] | Line color of Chart Border |
| "Details","Layout","ChartBorder","Size" | float | ["Details","Layout","ChartBorder","Size",2.1] | Line size / thickness of Chart Border |
| "Details","Layout","ChartBorder","Alpha" | float | ["Details","Layout","ChartBorder","Alpha",.5] | Line transparency of Chart Border |
| "Details","Layout","HasChartFill" | bool | ["Details","Layout","HasChartFill",True] | Fill Inner Chart Area (Does Not Include Label Area) |
| "Details","Layout","ChartFill","Color" | int - hex color | ["Details","Layout","ChartFill","Color",0xFF000] | Fill Color Of Inner Chart Area |
| "Details","Layout","ChartFill","Alpha" | float | ["Details","Layout","ChartFill","Alpha",.5] | Transparency Of Inner Chart Area Fill |
| "Details","Layout","HasBkgdFill" | bool | ["Details","Layout","HasBkgdFill",True] | Fill Chart Area (Drawn Overtop Of Any Pane Color) |
| "Details","Layout","BkgdFill","Color" | int - hex color | ["Details","Layout","BkgdFill","Color",0xFF000] | Fill Color Of Chart Area (Drawn Overtop Of Any Pane Color) |
| "Details","Layout","BkgdFill","Alpha" | float | ["Details","Layout","BkgdFill","Alpha",.5] | Transparency Of Chart Area Fill (Drawn Overtop Of Any Pane Color) |