Dataframes
Row64 Dataframes
Dataframes are the core structure for data storage and data-related messages in the Row64 platform. Dataframes are stored as .ramdb files.
Uploading and manipulating dataframes is done through the row64tools API for dataframes. Dashboards typically take dataframes as an input and use them in various ways:
- To display a table of data in a dashboard pane.
- As input for charts, geo, diagrams, and spreadsheets.
- To generate DataNodes, which are dataframe views built using function and formula manipulation of input dataframes. With DataNodes, you can build a data flow graph (called Global Graph in the DashAPI), and use the graph to drive other panes.
The simplest setup is to run the DashAPI in the same environment as row64server. That way, you just use .ramdb files from the /var/www/ramdb folder and it will automatically connect them to your dashboard. It is still possible to run the DashAPI in isolation with no server, however.
In the following training, the environment will conform to the simple setup of having DashAPI with row64server.
Row64 Server
You need to have Row64 Server installed and running on your system before you can view the dataframes. Although the absence of Server won't affect the DashAPI operability, you will not be able to view the generated dashboards without it.
Place a Dataframe
The following Python code provides an example of placing a dataframe on a dashboard:
from row64tools.dash64 import dash64
dash = dash64("/var/www/dashboards/temp/dframe_demo.dash")
pList = [
    ["Dashboard",   "",             "1600",     "900",  "y"],
    ["TopPane",     "Dashboard",    "*",        "*",    ""],
    ["BottomPane",  "Dashboard",    "*",        "20%",  ""]
]
dash.Layout.set_panes(pList)
dash.add_ramdb("/var/www/ramdb/live/RAMDB.Row64/Examples/HardwareSales.ramdb","DF1")
dash.add_df("DF1", "BottomPane")
dash.save()
This example creates a new dashboard with a simple pane structure, as defined in the pList block. Then, the panes are set on the dashboard with the dash.Layout.set_panes(pList) function. With the structure established, content can be added to the panes.
First, a RamDB file is loaded with the dash.add_ramdb() function, and a dataframe label for Row64 is given to the RamDB, which is visible in the Row64 global graph. Next, the dash.add_df() function is used to place the loaded RamDB file onto a specified dashboard pane.
To complete this example, paste the DashAPI configuration Python code into a new .py file through a text editor and save the file. Open a terminal, navigate to the file's directory, and execute the script. If the execution is a success, you will see an output message in the terminal that states that the dashboard was saved. The output will include the dashboard file and web path.
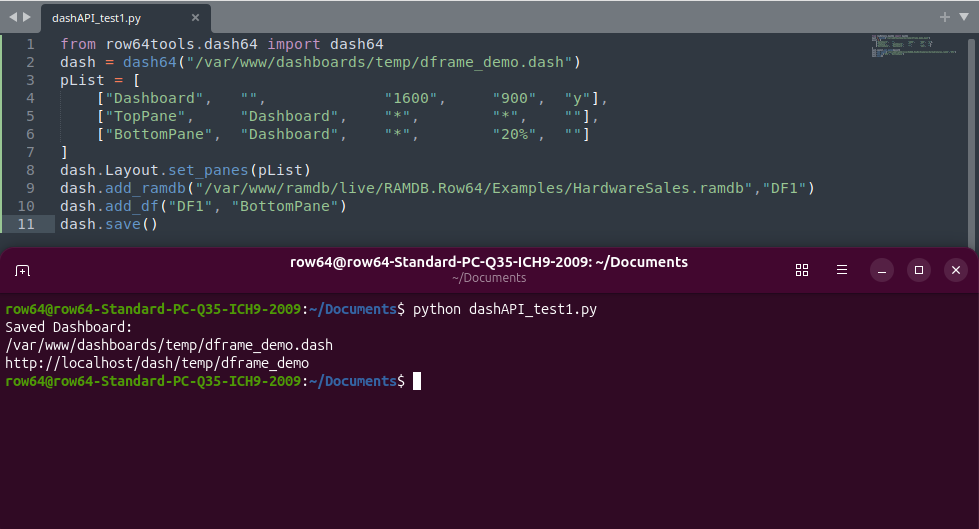
Navigate to or click on the outputted web link (e.g. http://localhost/dash/temp/dframe_demo). If you have Row64 Server installed and running, you will see the generated dashboard with the dataframe in your browser.
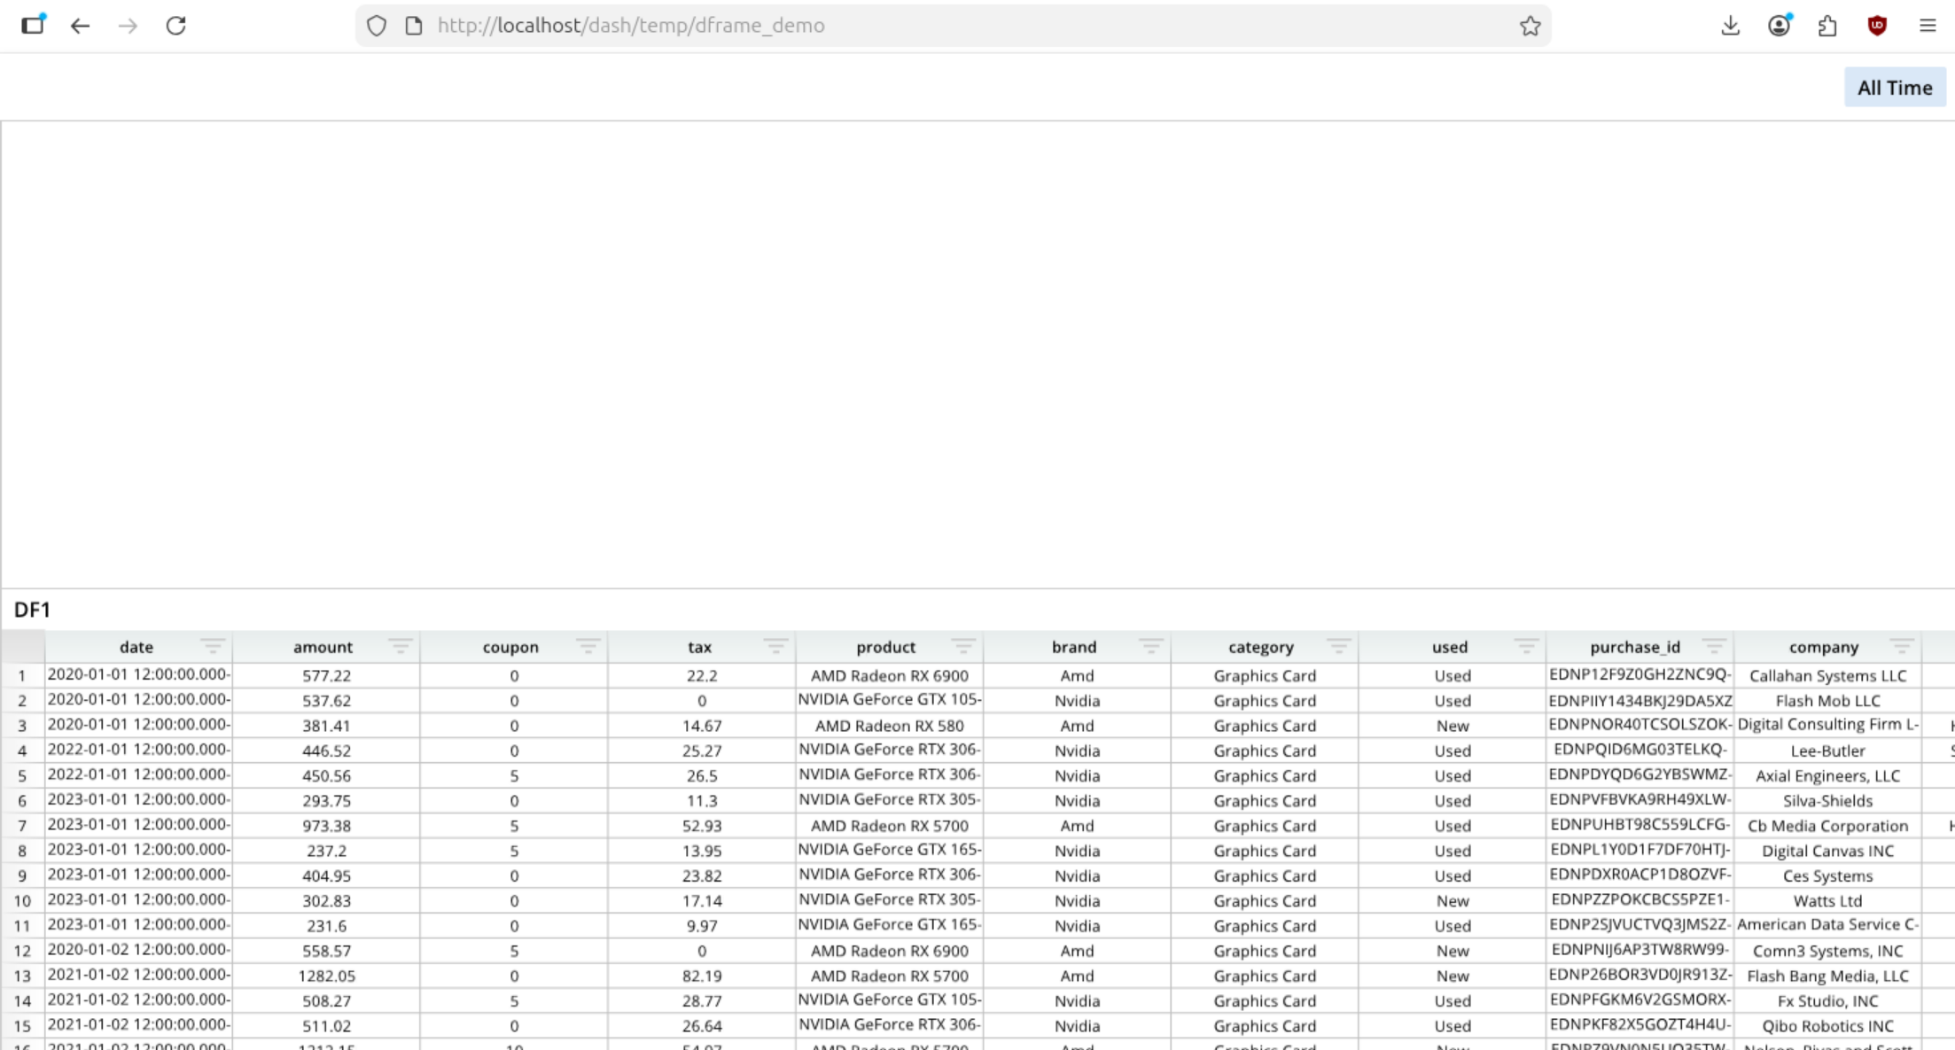
The dashboard needs to know the connection folder RAMDB.Row64 and the DB folder Examples. The dashboard infers the locations of the needed folders from the file path it was provided.
If you want to do a variant on RamDB loading, you can review the add_ramdb() function in the DashAPI, which is open-source on GitHub.
Customize Dataframe Visuals
There are many ways to visually change a dataframe. For example, you can change the column widths using the following Python configuration:
from row64tools.dash64 import dash64
dash = dash64("/var/www/dashboards/temp/dframe_demo.dash")
pList = [["Main","","1600","900","y"],["Top","Main","*","*",""],["Bot","Main","*","20%",""]]
dash.Layout.set_panes(pList)
dash.add_ramdb("/var/www/ramdb/live/RAMDB.Row64/Examples/HardwareSales.ramdb","DF1")
dash.add_df("DF1", "Bot")
cWidths = dash.Sheets.Items[ dash.Sheets.get_sheet_ind("DF1") ].ColumnWidths
for i, w in zip([1,2,4,5],[100,100,400,100]):cWidths[i] = w # widen columns
dash.save()
The preceding code sets columns 1, 2, 4, and 5 to widths 100, 100, 400, and 100, respectively. Note that it sets column indicies two different ways in the DashAPI. When they're set numerically, they are zero-based, so the value 1 is the second column.
We also do some operations using spreadsheet A1 notation. So, if we modify cell A1, then the 1 is referring to the first column and first row. This makes it simple work in a Python manner when you have lists and a spreadsheet manner for links with formulas.
The appearance of the dataframe can be modified in a few ways:
- With the Pane Def, which is the shared parameters on all panes.
- With the Pane Layout settings, which are unique for each pane type.
The following is an example of setting the paneDef for a Dataframe:
paneDef = [
    ["Layout","Zoom",1.18], # set the dataframe pane to zoom in
    ["Layout","ShowTitle",False] # set the dataframe pane to hide the title
    ]
dash.set_pane_def("BottomPane",paneDef)
You can simply copy and paste from this list to change options:
["Layout","Zoom",1.18], # set the dataframe pane to zoom in
["Layout","ShowTitle",False] # set the dataframe pane to hide the titleTitle
["Layout","Title","Title Text"]  # string - Displayed title text (if blank, then defaults to sheet name)
["Layout","TitleFont","Size",40]
["Layout","TitleFont","Color",0xff003e]
["Layout","TitleFont","Bold",True]
["Layout","TitleFont","Italic",True]
["Layout","TitleFont","Underline",True]
["Layout","TitleFont","Alpha",True] # transparency of the title font, between 0-1
["Layout","TitleAlignX",1] # Horizontal alignment, between 0-1
["Layout","ShowRowLabel",True]
["Layout","AllowCSVDownload",True]
Dataframe and Data Node Options
For a list of the customization options and commands available for dataframes and data nodes, please see the Dataframe Options page.
Dataframe Examples
Place a Dataframe
from row64tools.dash64 import dash64
dash = dash64("/var/www/dashboards/temp/dframe_demo.dash")
pList = [
    ["Dashboard",       "",             "1600",     "900",  "y"],
    ["TopPane",         "Dashboard",    "*",        "*",    ""],
    ["BottomPane",      "Dashboard",    "*",        "50%",  ""]
]
dash.Layout.set_panes(pList)
dash.add_ramdb("/var/www/ramdb/live/RAMDB.Row64/Examples/HardwareSales.ramdb","DF1")
dash.add_df("DF1", "BottomPane")
dash.save()
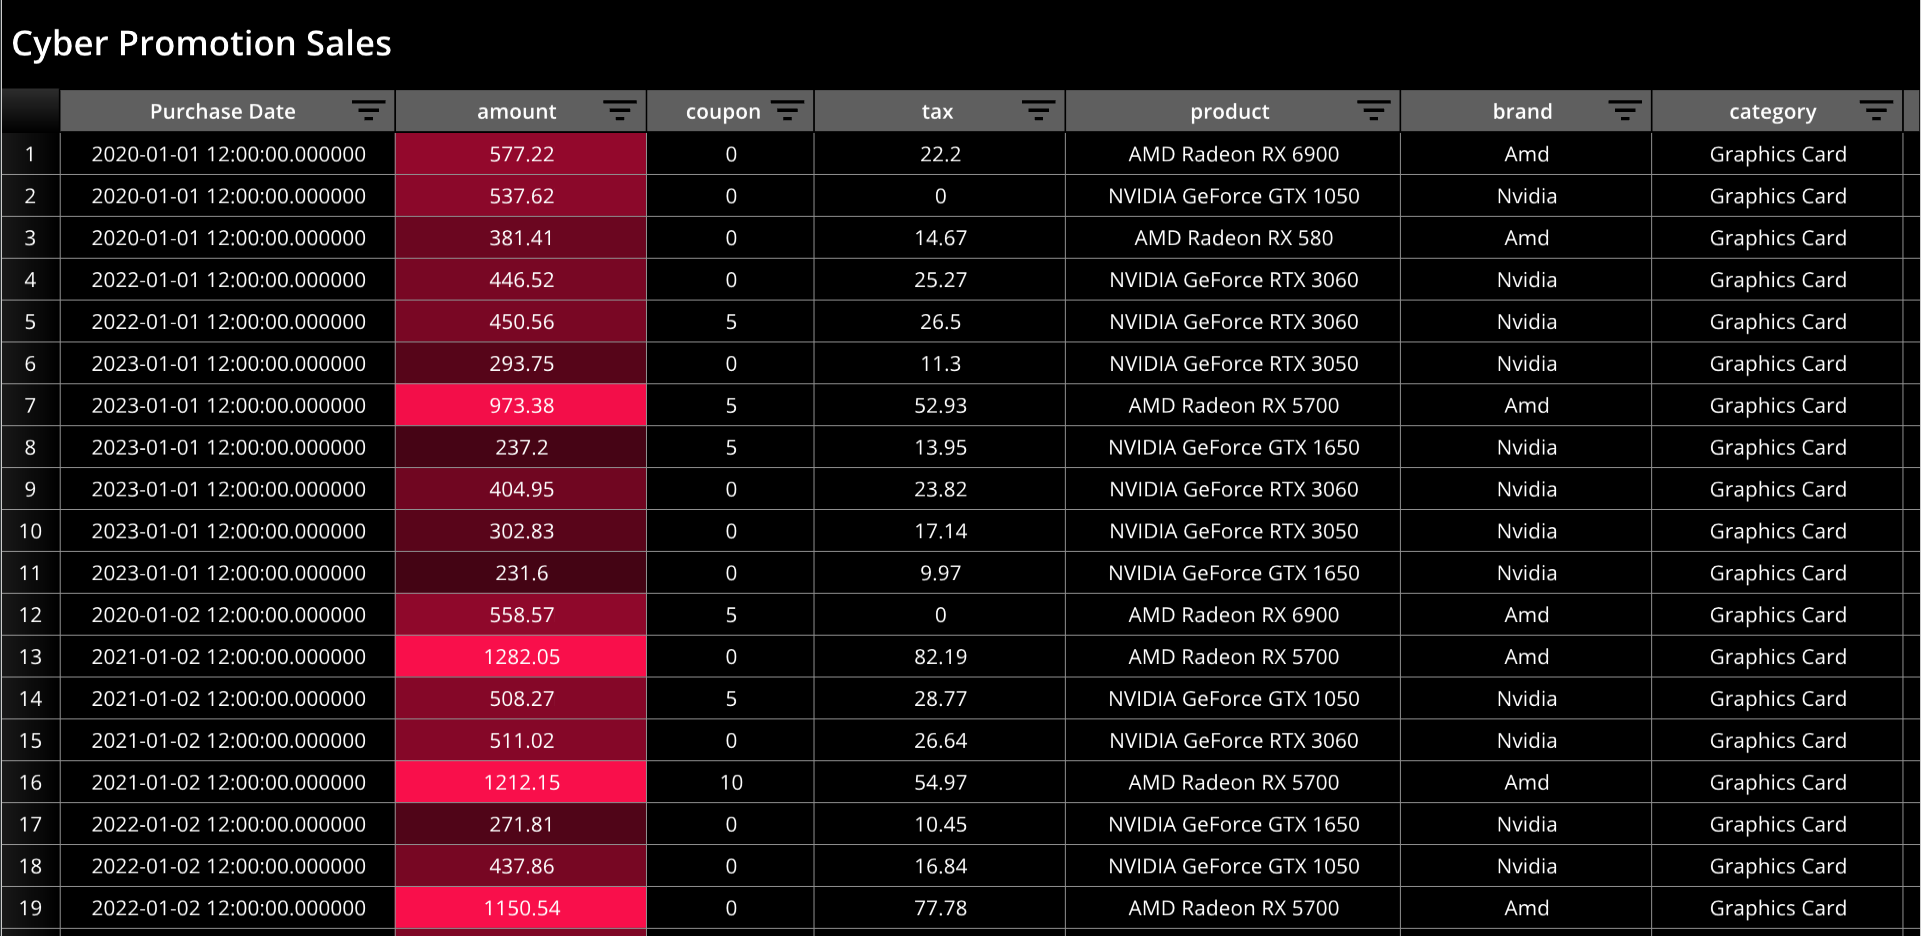
Modify a Dataframe
from row64tools.dash64 import dash64
dash = dash64("/var/www/dashboards/temp/dfmod.dash")
pList = [
    ["Main",       "",             "1600",     "900",  "y"]
]
dash.Layout.set_panes(pList)
dash.add_ramdb("/var/www/ramdb/live/RAMDB.Row64/Examples/HardwareSales.ramdb","DF1")
dfDef = [
    ["Format","Color",0x000000],
    ["Format","HeaderBar", "Color",  0x5F5F5F],
    ["Format","HeaderBar", "TxtColor", 0xFFFFFF],
    ["Layout","Zoom",1.78],
    ["Layout","Title","Cyber Promotion Sales"],
    ["Layout","TitleFont","Color",0xFFFFFF],
    ["Layout","TitleFont","Bold",True],
    ["Row","Height", 25],
    ["Column", 0, "DisplayName", "Purchase Date"],
    ["Column", 1, "Theme", [0x000000,0x64061e,0xa50a32,0xfa0f4c]],
    ["Column", 1, "Formula", "=B1/1000"],
    ["Column", 0, "Width", 200],
    ["Column", 2, "Width", 100],
    ["Column", 4, "Width", 200]
]
dash.add_df("DF1", "Main", dfDef)
dash.save()