Bar Chart
Syntax Overview
dash.add_bar( "chart_name", "pane_name", [series_data], [format_options] )
This function adds a bar chart to the dashboard.
- chart_name is a string specifying a unique name for the chart
- pane_name is a string specifying the target dashboard pane
- series_data is an list of inputs specifying the source data values
- format_options is an list of options describing the chart formatting
Series Data
Bar charts are series-based charts. The series_data argument is a list of series inputs. There is one list entry for each series.
Syntax
series_data = [
    [ "name",  "labels",  "values"  ],      # series 1
    [ "name2", "labels2", "values2" ]       # series 2
]
Each series input takes 3 values:
- Name: This is the displayed name of the series
- Labels: This is a reference to the source data for the categorical axis. For a vertical bar chart, this is the X axis.
- Values: This is a reference to the source data numeric axis. For a vertical bar chart, this is the Y axis.
Labels and Values use A1 Notation to indicate the source data. References must begin with = followed by the source sheet and column. For example, a reference may look like: =DNode1!A:A
Example
series_data = [
    [ "amount", "=DNode1!A:A", "=DNode1!B:B" ]  # Name, Labels, Values
]
Note
Currently, only dataframe references are allowed for dashboard charts.
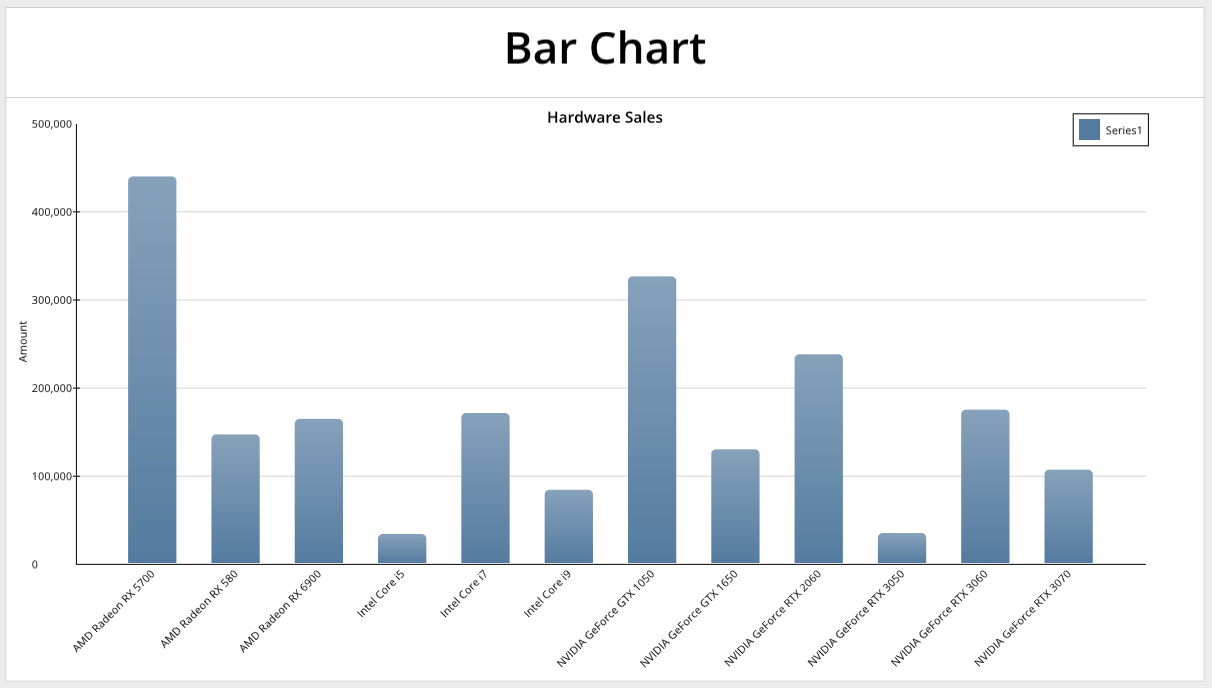
Code Example
import os
from row64tools.dash64 import dash64 as D64

# Specify output dashboard
dash = D64("/var/www/dashboards/temp/api_example_bar.dash")

# Set up the panes
pList = [
    ["Dashboard",       "",             "1600",     "900",  "y"],
    ["HeaderPane",      "Dashboard",    "*",        "120",  ""],
    ["BottomPane",      "Dashboard",    "*",        "*",    ""]
]
dash.Layout.set_panes(pList)

# Header Text
title = "Bar Chart Example"
dash.set_pane_def("HeaderPane", [["Text",title,"BH2V2S60"]])

# Set Up Dataframes
dash.add_ramdb("/var/www/ramdb/live/RAMDB.Row64/Examples/HardwareSales.ramdb","DF1")

dnDef = [[ "CROSSLINK", ["DF1",1,4], ["df","col","col"] ],
         [ "GROUPSUM",  [1],         ["col"]            ]]
dash.add_datanode("DNode1", "DF1", dnDef)

# Chart Data
series_data = [
    [ "amount", "=DNode1!A:A", "=DNode1!B:B" ]  # Name, Labels, Values
]

# Chart Formatting
format_options = [
    ["Format","AxisX","LabelRotation",-.35],
    ["Format","BarOrder",2],
    ["Details","Legend","Show",True],
    ["Details","Legend","Pos",[.88,.04]],
    ["Series",0,"Alphas",[0.8, 0.8, 0.8, 0.8]]
]

# Add the Chart to the Dashboard
dash.add_bar("Bar1", "BottomPane", series_data, format_options )

# Save the dashboard
dash.save()
Formatting Options
Syntax
Formatting options are passed in as a list of options. Each option is a list specifying a parameter to be changed and the value. Parameters may be identified by one or more keys. The value of the parameter to be set follows after the keys.
format_options = [
    [ "key1", "key2", ... , value ]
]
Example
format_options = [
    ["Format","AxisX","LabelRotation",-.35],
    ["Format","BarOrder",2],
    ["Details","Legend","Show",True],
    ["Details","Legend","Pos",[.88,.04]],
    ["Series",0,"Alphas",[0.8, 0.8, 0.8, 0.8]]
]
Parameters
The following are available formatting options for bar chart.
General Formatting
| Parameter Keys | Value Type | Example | Description |
|---|---|---|---|
| "Format","Color" | int - hex color | ["Format","Color",0x000000] | Background Color of the Pane |
| "Format","CrossLinking" | bool | ["Format","CrossLinking",False] | False = Disable Cross filtering for this Pane |
| "Format","Pad" | float | ["Format","Pad",.15] | Percentage of Total Height/Width Padding on Pane |
| "Format","LabelShift" | float | ["Format","LabelShift",.3] | Position of Value Labels as a percentage relative to top of bar |
| "Format","Rounding" | float | ["Format","Rounding",.3] | Bar Rounding between 0-1 |
| "Format","BottomRound" | float | ["Format","BottomRound",.3] | Apply Bar Rounding to Bottom of Bar |
| "Format","ChartPadX" | [float,float] | ["Format","ChartPadX",[.2, .2]] | Bar Chart Left & Right Padding within chart frame. Perc between 0-1 |
| "Format","AutoFit" | bool | ["Format","AutoFit",True] | Auto Fit The Bar ChartB Bars |
| "Format","BarSize" | float | ["Format","BarSize",.35] | Bar Width Filling Available Space as a Perctages between 0-1 |
| "Format","StackedBar" | bool | ["Format","StackedBar",True] | Bars are Stacked |
| "Format","HorizontalBar" | bool | ["Format","HorizontalBar",True] | Bars are Horizontal |
| "Format","BarOrder" | int | ["Format","BarOrder",1] | 0 None, 1 Small to large, 2 Large to small |
| "Format","ShowLabels" | bool | ["Format","ShowLabels", True] | Show Value Labels |
| "Format","LabelFont","Size" | float | ["Format","LabelFont","Size",25] | Font size of Value Lables (if ShowLabels is True) |
| "Format","LabelFont","Color" | int - hex color | ["Format","LabelFont","Color",0xFF000] | Font Color of Value Lables (if ShowLabels is True) |
| "Format","LabelFont","Bold" | bool | ["Format","LabelFont","Bold",True] | Font Bold of Value Lables (if ShowLabels is True) |
| "Format","LabelFont","Italic" | bool | ["Format","LabelFont","Italic",True] | Font Italic of Value Lables (if ShowLabels is True) |
| "Format","LabelFont","Underline" | bool | ["Format","LabelFont","Underline",True] | Font Underline of Value Lables (if ShowLabels is True) |
| "Format","LabelFont","Alpha" | float | ["Format","LabelFont","Alpha",.5] | Font Transparency of Value Lables (if ShowLabels is True) |
Chart Options
| Parameter Keys | Value Type | Example | Description |
|---|---|---|---|
| "Details", "Title" | string | ["Details", "Title", "My Chart Title"] | Chart title |
| "Details", "ShowTitle" | boolean | ["Details", "ShowTitle", True] | Indicates whether to display the chart title |
| "Details", "TitlePos" | number list[2] | ["Details", "TitlePos", [0.5, 0.035] ] | Position of the chart title relative to the top left corner, given by a list of two numeric values that are the percentage of the pane width and pane height. Numbers should be within [0, 1]. |
| "Details", "Layout", "RPadding" | number | ["Details", "Layout", "RPadding", 10] | Number of pixels to pad the chart within the pane on the right side. |
| "Details", "Layout", "LPadding" | number | ["Details", "Layout", "LPadding", 10] | Number of pixels to pad the chart within the pane on the left side. |
X Axis
| Parameter Keys | Value Type | Example | Description |
|---|---|---|---|
| "Format","AxisX","ShowAxis" | bool | ["Format","AxisX","ShowAxis",True] | Show the x-Axis on the Bar Chart |
| "Format","AxisX","ShowMajorTicks" | bool | ["Format","AxisX","ShowMajorTicks",True] | Show Major Ticks on the x-axis |
| "Format","AxisX","ShowMinorTicks" | bool | ["Format","AxisX","ShowMinorTicks",True] | Show Minor Ticks on the x-axis |
| "Format","AxisX","ShowEndTicks" | bool | ["Format","AxisX","ShowEndTicks",True] | Put Ticks on the end of the x-axis |
| "Format","AxisX","ShowEndLabels" | bool | ["Format","AxisX","ShowEndLabels",True] | Show End Lables on x-axis |
| "Format","AxisX","TickShift" | bool | ["Format","AxisX","TickShift",.7] | Shift Ticks: 0 = center, < 0 = shift out (left or down), > 0 = shift in (right or up) |
| "Format","AxisX","TickSize" | bool | ["Format","AxisX","TickSize",1.7] | Size of Tick in Pixels |
| "Format","AxisX","Line","Color" | int - hex color | ["Format","AxisX","Line","Color",0xFF000] | Line color on the x-axis |
| "Format","AxisX","Line","Size" | float | ["Format","AxisX","Line","Size",2.1] | Line size / thickness on the x-axis |
| "Format","AxisX","Line","Alpha" | float | ["Format","AxisX","Line","Alpha",.5] | Line transparency on the x-axis, between 0-1 |
| "Format","AxisX","ShowLabels" | bool | ["Format","AxisX","ShowLabels",True] | Show Labels on x-axis |
| "Format","AxisX","LabelFont","Size" | float | ["Format","AxisX","LabelFont","Size",25] | Font size on x-axis Labels |
| "Format","AxisX","LabelFont","Color" | int - hex color | ["Format","AxisX","LabelFont","Color",0xFF000] | Font Color on x-axis Labels |
| "Format","AxisX","LabelFont","Bold" | bool | ["Format","AxisX","LabelFont","Color",0xFF000] | Font Bold on x-axis Labels |
| "Format","AxisX","LabelFont","Italic" | bool | ["Format","AxisX","LabelFont","Italic",True] | Font Italic on x-axis Labels |
| "Format","AxisX","LabelFont","Underline" | bool | ["Format","AxisX","LabelFont","Underline",True] | Font Underline on x-axis Labels |
| "Format","AxisX","LabelFont","Alpha" | float | ["Format","AxisX","LabelFont","Alpha",.5] | Font Transparency on x-axis Labels |
| "Format","AxisX","LabelShift" | float | ["Format","AxisX","LabelShift",.5] | Shift Labels Perpedicular To Line: 0 = base, < 0 = shift out (left or down), > 0 = shift in (right or up) |
| "Format","AxisX","LabelFormat" | string | ["Format","AxisX","LabelFormat","#,##0"] | Labels Number Format Code (ex: decimal places, commas, dollar sign, etc) |
| "Format","AxisX","LabelAlign" | float | ["Format","AxisX","LabelAlign",.1] | Shift Labels Parallel To Line: 0 = center, < 0 = align bottom (or left), > 0 align top (or right) |
| "Format","AxisX","LabelRotation" | float | ["Format","AxisX","LabelRotation",.5] | Labels Rotation In Radians: 0 = no rotation, 1 = 90 degrees clockwise, -1 = 90 degrees counter-clockwise |
| "Format","AxisX","ShowTitle" | bool | ["Format","AxisX","ShowTitle",True] | Show x-axis Title |
| "Format","AxisX","Title" | string | ["Format","AxisX","Title","Title Text Here"] | Title Text on x-axis |
| "Format","AxisX","TitleFont","Size" | float | ["Format","AxisX","TitleFont","Size",25] | Font size on x-axis Title |
| "Format","AxisX","TitleFont","Color" | int - hex color | ["Format","AxisX","TitleFont","Color",0xFF000] | Font Color on x-axis Title |
| "Format","AxisX","TitleFont","Bold" | bool | ["Format","AxisX","TitleFont","Bold",True] | Font Bold on x-axis Title |
| "Format","AxisX","TitleFont","Italic" | bool | ["Format","AxisX","TitleFont","Italic",True] | Font Italic on x-axis Title |
| "Format","AxisX","TitleFont","Underline" | bool | ["Format","AxisX","TitleFont","Underline",True] | Font Underline on x-axis Title |
| "Format","AxisX","TitleFont","Alpha" | float | ["Format","AxisX","TitleFont","Alpha",.5] | Font Transparency on x-axis Title |
| "Format","AxisX","TitlePos" | [float,float] | ["Format","AxisX","TitlePos",[0.5,0.5]] | X-Axis Title x,y as a percentage of Pane Height/Width |
Y Axis
| Parameter Keys | Value Type | Example | Description |
|---|---|---|---|
| "Format","AxisY","ShowAxis" | bool | ["Format","AxisY","ShowAxis",True] | Show the y-Axis on the Bar Chart |
| "Format","AxisY","ShowMajorTicks" | bool | ["Format","AxisY","ShowMajorTicks",True] | Show Major Ticks on the y-Axis |
| "Format","AxisY","ShowMinorTicks" | bool | ["Format","AxisY","ShowMinorTicks",True] | Show Minor Ticks on the y-Axis |
| "Format","AxisY","ShowEndTicks" | bool | ["Format","AxisY","ShowEndTicks",True] | Put Ticks on the end of the y-Axis |
| "Format","AxisY","ShowEndLabels" | bool | ["Format","AxisY","ShowEndLabels",True] | Show End Lables on y-Axis |
| "Format","AxisY","TickShift" | bool | ["Format","AxisY","TickShift",.7] | Shift Ticks: 0 = center, < 0 = shift out (left or down), > 0 = shift in (right or up) |
| "Format","AxisY","TickSize" | bool | ["Format","AxisY","TickSize",1.7] | Size of Tick in Pixels |
| "Format","AxisY","Line","Color" | int - hex color | ["Format","AxisY","Line","Color",0xFF000] | Line color on the y-Axis |
| "Format","AxisY","Line","Size" | float | ["Format","AxisY","Line","Size",2.1] | Line size / thickness on the y-Axis |
| "Format","AxisY","Line","Alpha" | float | ["Format","AxisY","Line","Alpha",.5] | Line transparency on the y-Axis, between 0-1 |
| "Format","AxisY","ShowLabels" | bool | ["Format","AxisY","ShowLabels",True] | Show Labels on y-Axis |
| "Format","AxisY","LabelFont","Size" | float | ["Format","AxisY","LabelFont","Size",25] | Font size on y-Axis Labels |
| "Format","AxisY","LabelFont","Color" | int - hex color | ["Format","AxisY","LabelFont","Color",0xFF000] | Font Color on y-Axis Labels |
| "Format","AxisY","LabelFont","Bold" | bool | ["Format","AxisY","LabelFont","Bold",True] | Font Bold on y-Axis Labels |
| "Format","AxisY","LabelFont","Italic" | bool | ["Format","AxisY","LabelFont","Italic",True] | Font Italic on y-Axis Labels |
| "Format","AxisY","LabelFont","Underline" | bool | ["Format","AxisY","LabelFont","Underline",True] | Font Underline on y-Axis Labels |
| "Format","AxisY","LabelFont","Alpha" | float | ["Format","AxisY","LabelFont","Alpha",.5] | Font Transparency on y-Axis Labels |
| "Format","AxisY","LabelShift" | float | ["Format","AxisY","LabelShift",.5] | Shift Labels Perpedicular To Line: 0 = base, < 0 = shift out (left or down), > 0 = shift in (right or up) |
| "Format","AxisY","LabelFormat" | string | ["Format","AxisY","LabelFormat","#,##0"] | Labels Number Format Code (ex: decimal places, commas, dollar sign, etc) |
| "Format","AxisY","LabelAlign" | float | ["Format","AxisY","LabelAlign",.1] | Shift Labels Parallel To Line: 0 = center, < 0 = align bottom (or left), > 0 align top (or right) |
| "Format","AxisY","LabelRotation" | float | ["Format","AxisY","LabelRotation",.5] | Labels Rotation In Radians: 0 = no rotation, 1 = 90 degrees clockwise, -1 = 90 degrees counter-clockwise |
| "Format","AxisY","ShowTitle" | bool | ["Format","AxisY","ShowTitle",True] | Show y-Axis Title |
| "Format","AxisY","Title" | string | ["Format","AxisY","Title","Title Text Here"] | Title Text on y-Axis |
| "Format","AxisY","TitleFont","Size" | float | ["Format","AxisY","TitleFont","Size",25] | Font size on y-Axis Title |
| "Format","AxisY","TitleFont","Color" | int - hex color | ["Format","AxisY","TitleFont","Color",0xFF000] | Font Color on y-Axis Title |
| "Format","AxisY","TitleFont","Bold" | bool | ["Format","AxisY","TitleFont","Bold",True] | Font Bold on y-Axis Title |
| "Format","AxisY","TitleFont","Italic" | bool | ["Format","AxisY","TitleFont","Italic",True] | Font Italic on y-Axis Title |
| "Format","AxisY","TitleFont","Underline" | bool | ["Format","AxisY","TitleFont","Underline",True] | Font Underline on y-Axis Title |
| "Format","AxisY","TitleFont","Alpha" | float | ["Format","AxisY","TitleFont","Alpha",.5] | Font Transparency on y-Axis Title |
| "Format","AxisY","TitlePos" | [float,float] | ["Format","AxisY","TitlePos",[0.5,0.5]] | y-Axis Title x,y as a percentage of Pane Height/Width |
Y Grid
| Parameter Keys | Value Type | Example | Description |
|---|---|---|---|
| "Format","GridlineY","Type" | int | ["Format","GridlineY","Type",1] | Y Grid Type: 0=grid_categorical, 1=grid_numeric, 2=grid_datetime |
| "Format","GridlineY","ShowMajor" | bool | ["Format","GridlineY","ShowMajor",True] | Show Major gridlines on Y Grid |
| "Format","GridlineY","ShowMinor" | bool | ["Format","GridlineY","ShowMinor",True] | Show Minor gridlines on Y Grid |
| "Format","GridlineY","MajorUnit" | float | ["Format","GridlineY","MajorUnit",1.0] | Major Unit on Y Grid |
| "Format","GridlineY","MinorUnit" | float | ["Format","GridlineY","MinorUnit",1.0] | Minor Unit on Y Grid |
| "Format","GridlineY","AutoMajor" | bool | ["Format","GridlineY","AutoMajor",True] | Automatically Determine Major Unit on Y Grid, sets the MajorBase, MajorUnit, and the MajorStart |
| "Format","GridlineY","AutoMinor" | bool | ["Format","GridlineY","AutoMinor",True] | Automatically Determine Minor Unit on Y Grid, sets the MinorBase & MinorUnit |
| "Format","GridlineY","MinBound" | float | ["Format","GridlineY","MinBound",10] | Minimum Value For Range Of Y Grid (only used if AutoMin Is Off) |
| "Format","GridlineY","MaxBound" | float | ["Format","GridlineY","MaxBound",10] | Maximum Value For Range Of Y Grid (only used if AutoMax Is Off) |
| "Format","GridlineY","AutoMin" | bool | ["Format","GridlineY","AutoMin", True] | Automatically Determine MinBound on Y Grid |
| "Format","GridlineY","AutoMax" | bool | ["Format","GridlineY","AutoMax", True] | Automatically Determine MaxBound on Y Grid |
| "Format","GridlineY","PreferZero" | bool | ["Format","GridlineY","PreferZero", False] | Include 0 in the Range of The Y Grid |
| "Format","GridlineY","MajorLine","Color" | int - hex color | ["Format","GridlineY","MajorLine","Color",0xFF000] | Line color on the y-Grid |
| "Format","GridlineY","MajorLine","Size" | float | ["Format","GridlineY","MajorLine","Size",2.1] | Line size / thickness on the y-Grid |
| "Format","GridlineY","MajorLine","Alpha" | float | ["Format","GridlineY","MajorLine","Alpha",.5] | Line transparency on the y-Grid, between 0-1 |
| "Format","GridlineY","GridBase" | int | ["Format","GridlineY","GridBase", 68] | ASCII char value for datetime span divisions: 0 = not set, 68 = 'D' day, 77 = 'M' month, 89 = 'Y' year |
| "Format","GridlineY","MajorBase" | int | ["Format","GridlineY","MajorBase", 68] | ASCII char value for datetime span divisions: 0 = not set, 68 = 'D' day, 77 = 'M' month, 89 = 'Y' year |
| "Format","GridlineY","MinorBase" | int | ["Format","GridlineY","MinorBase", 68] | ASCII char value for datetime span divisions: 0 = not set, 68 = 'D' day, 77 = 'M' month, 89 = 'Y' year |
| "Format","GridlineY","MajorStart" | float | ["Format","GridlineY","MajorStart", 10] | Start Value For The y-Grid |
Series Data Options
(Second value is series index)
| Parameter Keys | Value Type | Example | Description |
|---|---|---|---|
| "Series",0,"Name" | string | ["Series",0,"Name","Enter Series Name"] | Name of the series |
| "Series",0,"Labels" | string | ["Series",0,"Labels","=DNode1!B:B"] | Lables on the series (list or cell reference like Excel). Ex: '={"Label_01","Label_02","Label_03"}' |
| "Series",0,"Values" | string | ["Series",0,"Values","=DNode1!A:A"] | Cell reference of the values in the series (list or cell reference like Excel). Ex: '={1,3,2.95}' |
| "Series",0,"ColorMode" | int | ["Series",0,"ColorMode","Enter Series Name"] | Color Fill Style: 0=solid, 1=simple gradient, 2=four-color gradient, 3=series multi |
| "Series",0,"Colors" | [int,int,int,int] | ["Series",0,"Colors",[0x547B9F,0x547B9F,0x547B9F,0x547B9F]] | Color Theme For Bar Chart Draw |
| "Series",0,"Alphas" | [float,float,float,float] | ["Series",0,"Alphas",[1.0, 1.0, 1.0, 1.0]] | Color Fill Transparency Values |
Details
| Parameter Keys | Value Type | Example | Description |
|---|---|---|---|
| "Details","ShowTitle" | bool | ["Details","ShowTitle",True] | Show Chart Title |
| "Details","Title" | string | ["Details","Title","Enter Chart Title"] | String of Chart Title |
| "Details","GroupType" | int | ["Details","GroupType",1] | 0 = Series Not Grouped, 1 = Series are Grouped |
| "Details","TitleFont","Size" | float | ["Details","TitleFont","Size",25] | Font size of Title (if ShowTitle is True) |
| "Details","TitleFont","Color" | int - hex color | ["Details","TitleFont","Color",0xFF000] | Font Color of Title (if ShowTitle is True) |
| "Details","TitleFont","Bold" | bool | ["Details","TitleFont","Bold",True] | Font Bold of Title (if ShowTitle is True) |
| "Details","TitleFont","Italic" | bool | ["Details","TitleFont","Italic",True] | Font Italic of Title (if ShowTitle is True) |
| "Details","TitleFont","Underline" | bool | ["Details","TitleFont","Underline",True] | Font Underline of Title (if ShowTitle is True) |
| "Details","TitleFont","Alpha" | float | ["Details","TitleFont","Alpha",.5] | Font Transparency of Title (if ShowTitle is True) |
| "Details","TitlePos" | [float,float] | ["Details","TitlePos",[.5,.05]] | Chart Title x,y as a percentage of Pane Height/Width |
| "Details","Gaps" | [float,float] | ["Details","Gaps",[.46,.27]] | Major Gap between Bar Chart series, followed by Minor Gap between bars |
| "Details","Legend","Show" | bool | ["Details","Legend","Show",True] | Show Chart Legend |
| "Details","Legend","Pos" | [float,float] | ["Details","Legend","Pos", [0.755, 0.15]] | Chart Legend x,y as a percentage of dimensions |
| "Details","Legend","Dim" | [float,float] | ["Details","Legend","Dim", [100.0, 100.0]] | Chart Legend w,y dimensions in pixels |
| "Details","Legend","HasBorder" | bool | ["Details","Legend","HasBorder",True] | Chart Legend Border is Visible |
| "Details","Legend","Border","Color" | int - hex color | ["Details","Legend","Border","Color",0xFF000] | Line color of Legend Border |
| "Details","Legend","Border","Size" | float | ["Details","Legend","Border","Size",2.1] | Line size / thickness of Legend Border |
| "Details","Legend","Border","Alpha" | float | ["Details","Legend","Border","Alpha",.5] | Line transparency of Legend Border |
| "Details","Legend","HasFill" | bool | ["Details","Legend","HasFill", True] | Chart Legend is Filled |
| "Details","Legend","Fill","Color" | int - hex color | ["Details","Legend","Fill","Color",0xFF000] | Fill Color of Legend |
| "Details","Legend","Fill","Alpha" | float | ["Details","Legend","Fill","Alpha",.5] | Transparency of Legend Fill |
| "Details","Legend","Font","Size" | float | ["Details","Legend","Font","Size",25] | Font size of Legend |
| "Details","Legend","Font","Color" | int - hex color | ["Details","Legend","Font","Color",0xFF000] | Font Color of Legend |
| "Details","Legend","Font","Bold" | bool | ["Details","Legend","Font","Bold",True] | Font Bold of Legend |
| "Details","Legend","Font","Italic" | bool | ["Details","Legend","Font","Italic",True] | Font Italic of Legend |
| "Details","Legend","Font","Underline" | bool | ["Details","Legend","Font","Underline",True] | Font Underline of Legend |
| "Details","Legend","Font","Alpha" | float | ["Details","Legend","Font","Alpha",.5] | Font Transparency of Legend |
| "Details","Legend","ChipSize" | float | ["Details","Legend","ChipSize",7.0] | Legend Chip Size |
| "Details","Legend","ChipSpacing" | float | ["Details","Legend","ChipSpacing",5.0] | Legend Spacing Between Chips |
| "Details","Layout","RPadding" | float | ["Details","Layout","RPadding",10.0] | Chart Right Padding Inset In Addition To Pane Padding |
| "Details","Layout","LPadding" | float | ["Details","Layout","LPadding",10.0] | Chart Left Padding Inset In Addition To Pane Padding |
| "Details","Layout","TPadding" | float | ["Details","Layout","TPadding",10.0] | Chart Top Padding Inset In Addition To Pane Padding |
| "Details","Layout","BPadding" | float | ["Details","Layout","BPadding",10.0] | Chart Bottom Padding Inset In Addition To Pane Padding |
| "Details","Layout","HasChartBorder" | bool | ["Details","Layout","HasChartBorder",True] | Chart Border Around Chart Area (Does Not Include Label Area) |
| "Details","Layout","ChartBorder","Color" | int - hex color | ["Details","Layout","ChartBorder","Color",0xFF000] | Line color of Chart Border |
| "Details","Layout","ChartBorder","Size" | float | ["Details","Layout","ChartBorder","Size",2.1] | Line size / thickness of Chart Border |
| "Details","Layout","ChartBorder","Alpha" | float | ["Details","Layout","ChartBorder","Alpha",.5] | Line transparency of Chart Border |
| "Details","Layout","HasChartFill" | bool | ["Details","Layout","HasChartFill",True] | Fill Inner Chart Area (Does Not Include Label Area) |
| "Details","Layout","ChartFill","Color" | int - hex color | ["Details","Layout","ChartFill","Color",0xFF000] | Fill Color Of Inner Chart Area |
| "Details","Layout","ChartFill","Alpha" | float | ["Details","Layout","ChartFill","Alpha",.5] | Transparency Of Inner Chart Area Fill |
| "Details","Layout","HasBkgdFill" | bool | ["Details","Layout","HasBkgdFill",True] | Fill Chart Area (Drawn Overtop Of Any Pane Color) |
| "Details","Layout","BkgdFill","Color" | int - hex color | ["Details","Layout","BkgdFill","Color",0xFF000] | Fill Color Of Chart Area (Drawn Overtop Of Any Pane Color) |
| "Details","Layout","BkgdFill","Alpha" | float | ["Details","Layout","BkgdFill","Alpha",.5] | Transparency Of Chart Area Fill (Drawn Overtop Of Any Pane Color) |