Spreadsheet
The DashAPI can add either a single, or multiple, spreadsheets to a dashboard.
For information on adding multiple spreadsheets to a dashboard, please see the Multi-Spreadsheet page.
Required Components
Adding a spreadsheet requires the following components:
ssDef = []- A list that defines the content of the spreadsheet.
- This list can include text fromat codes to format the visual appearance of text in cells.
dim = []- A list that determines the structure of the spreadsheet. This list establishes the row and column count, as well as the focus or crop area.
dash.add_spreadsheet()- The function that places the spreadsheet on a designated pane.
Components Syntax
ssDef
ssDef = [
    ["A1","Item","BCfa0f4cOFFFFFF"],["B1","Amount","BCfa0f4cOFFFFFF"],
    ["A2","Item 1:"],["B2",    "4.12"],
    ["A3","Item 2:"],["B3",    "6.44"],
    ...
]
The ssDef ("spreadsheet definition") list builds the spreadsheet. This list contains the spreadsheet's cell contents, which can include values, formulas, and formatting options. Each list item is enclosed in brackets [ ], and each of these list items represents a cell in the spreadsheet.
Every list item must include a cell reference, in A1 notation, a content item, and optional formatting. List items conform to the following syntax:
["CELL_REFERENCE", "CELL_CONTENT", "CELL_TEXT_FORMATTING", "CELL_NUMBER_FORMATTING"]
"CELL_REFERENCE"- A reference to a spreadsheet cell, in A1 notation. This reference associates the ssDef item to a cell on the spreadsheet.
- Example:
B3
"CELL_CONTENT"- Content for the spreadsheet cell. The cell content can contain static values and formulas. Any content type that is supported in the Row64 platform is supported in the DashAPI. The content item should be enclosed in quotation marks, regardless of the type.
- Example:
"4.12" - Cell content can consist of static values, formulas, linked equations, or dataframe references.
"CELL_TEXT_FORMATTING"(Optional)- An optional argument that formats the text of the cell.
- This argument accepts text format codes.
- Example:
"BCfa0f4cOFFFFFF"
"CELL_NUMBER_FORMATTING"(Optional)- An optional argument that formats numbers, if a number is the cell content.
- This argument accepts number format codes.
- Example:
"#,###.00"
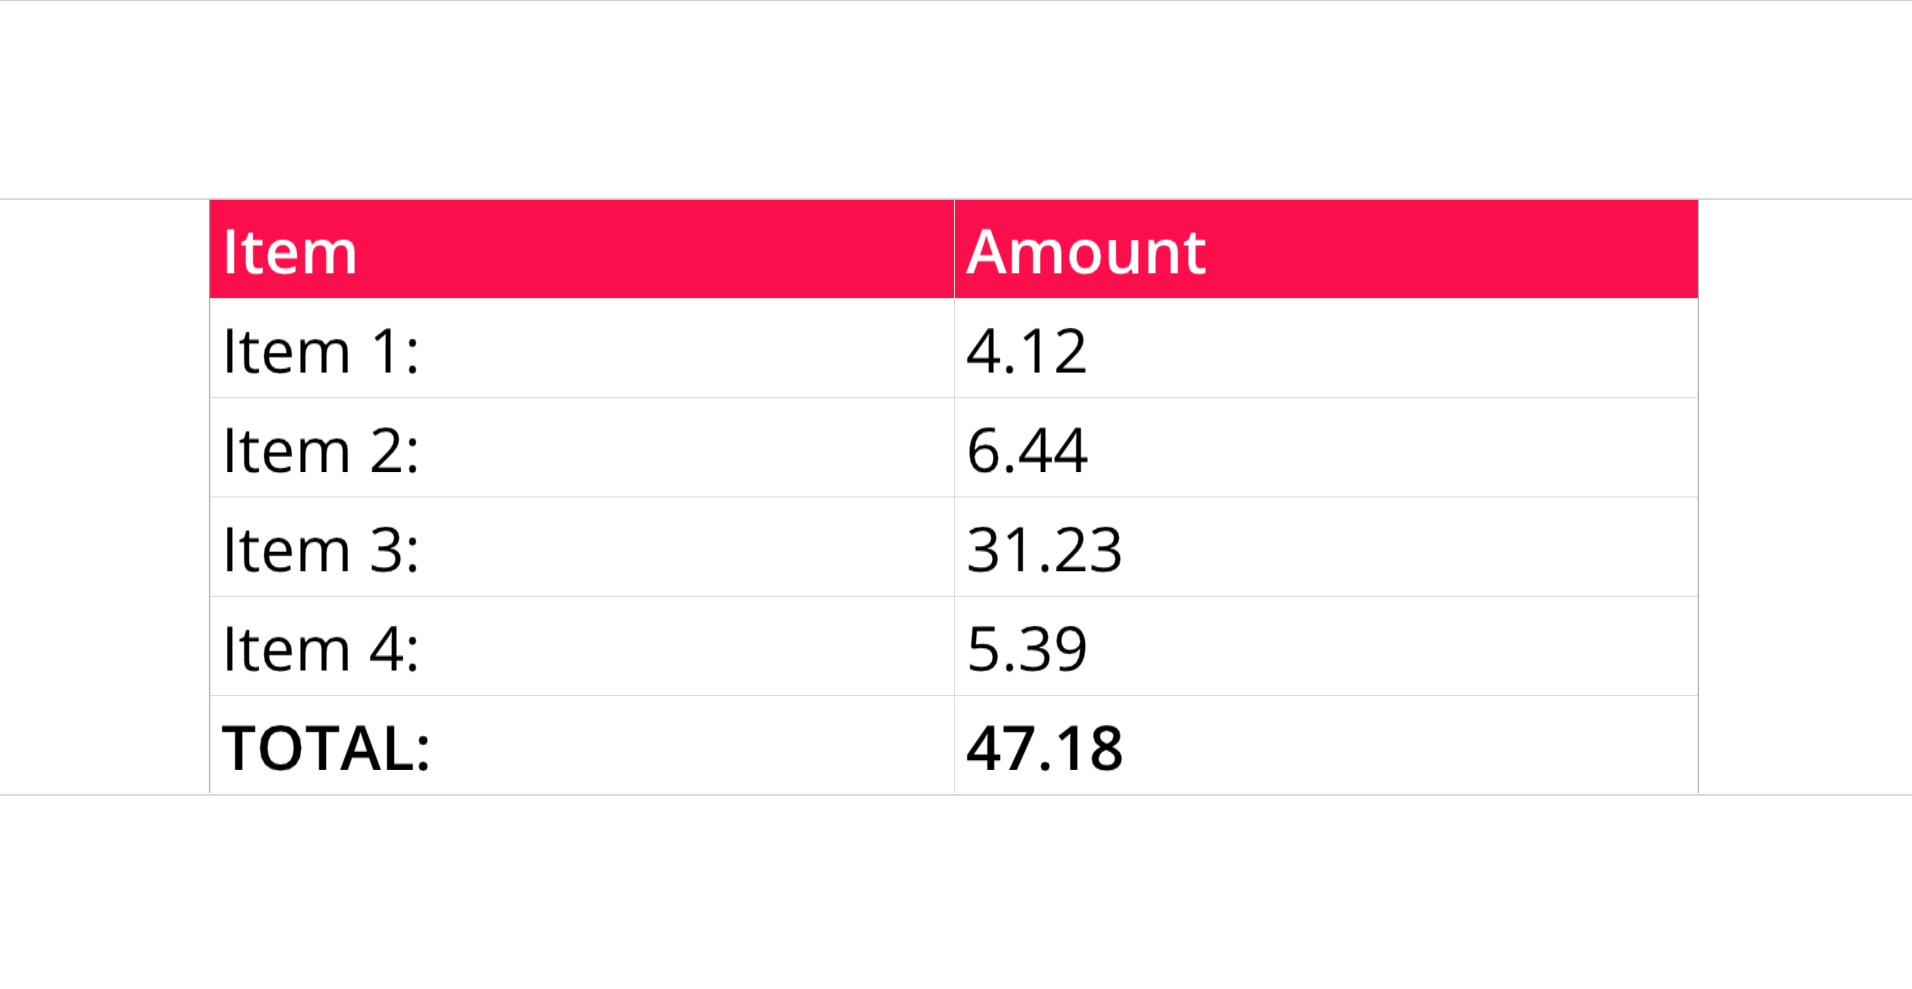
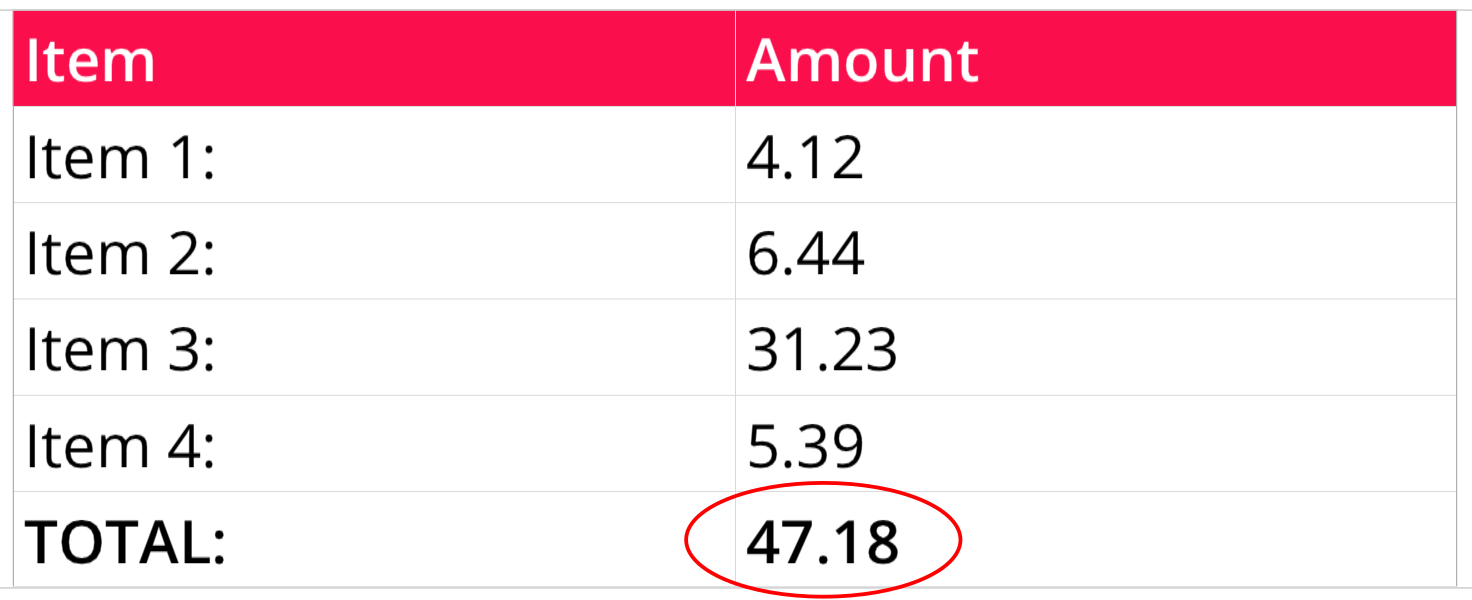
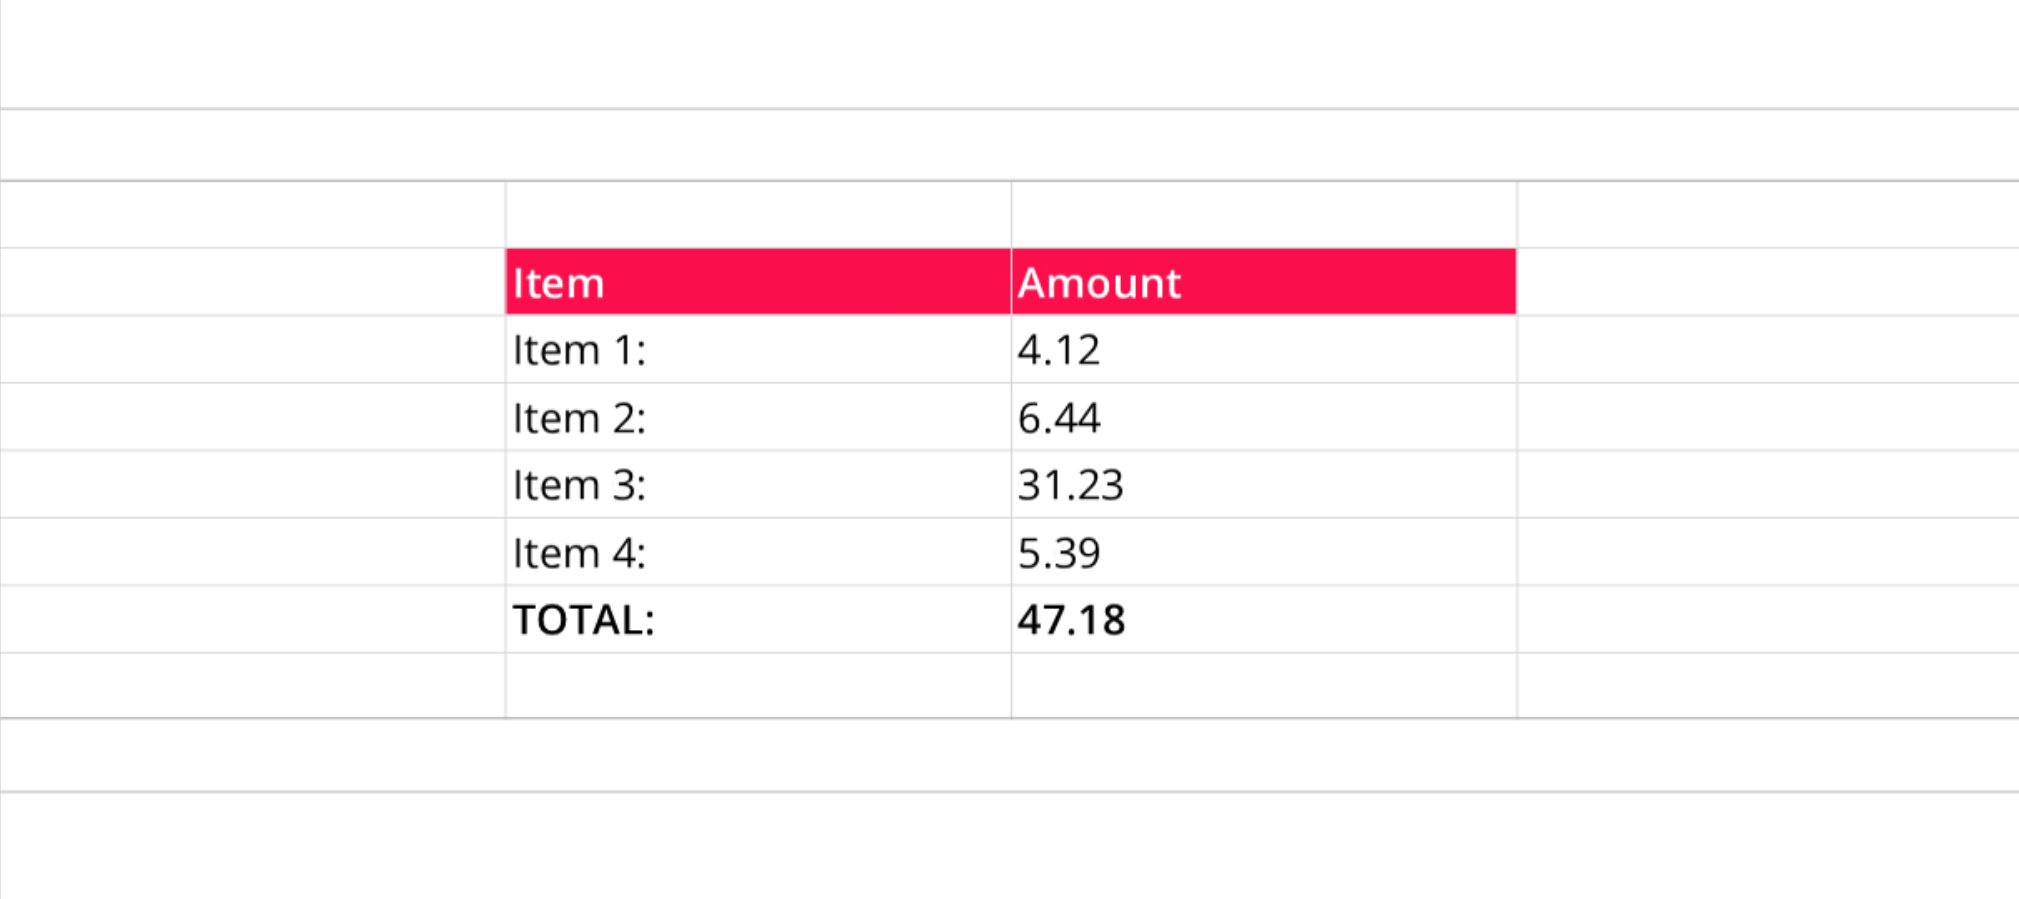
The following is an example of an ssDef list item with all parameters:
["B6", "=SUM(B2:B5)","B","#,###.00"]
This ssDef item generates the bottom-right cell in the following image:
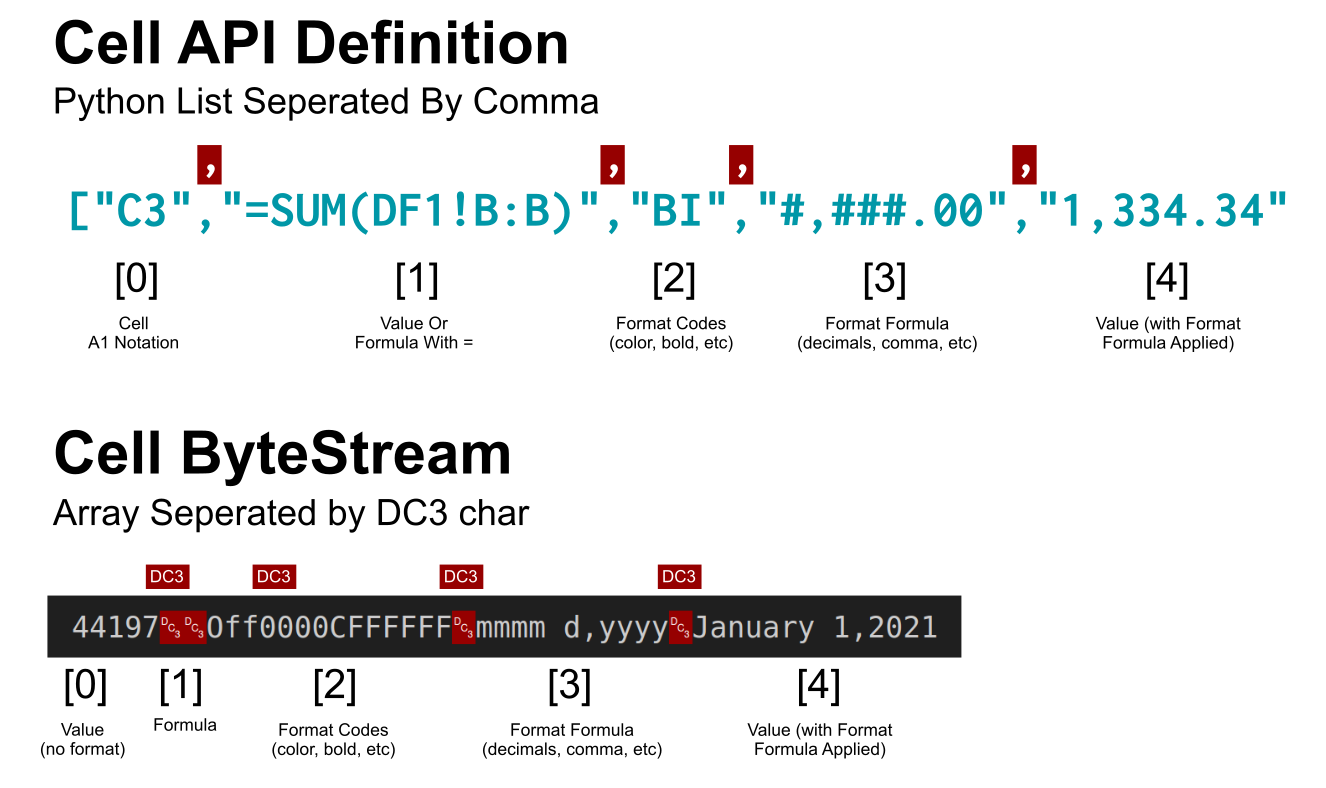
In ByteStream, the cell list is separated by the DC3 charater instead of commas, and also follows a slightly different array order.
dim
dim = [CROP_LEFT, CROP_TOP, CROP_RIGHT, CROP_BOTTOM]
The dim list controls how many rows and columns are visible on a spreadsheet. Each numeric value in this list represents how many rows or columns are shown from the left, top, right, and bottom of the spreadsheet.
CROP_LEFT- A number that sets the amount of visible columns to the left.
- To increase the amount of visible columns from the left of the spreadsheet, use decreasing negative values.
- Think of moving backwards from the leftmost column in the sheet that has content.
CROP_TOP- A number that sets the amount of visible rows from the top.
- To increase the amount of visible rows on the top of the spreadsheet, use decreasing negative values.
- Think of moving backwards from the top of the spreadsheet. For example, to include a new row on top of a spreadsheet's header, use
-1.
- Think of moving backwards from the top of the spreadsheet. For example, to include a new row on top of a spreadsheet's header, use
CROP_RIGHT- A number that sets the amount of visible columns to the right.
- To increase the columns to the right, use increasing positive values for this argument.
CROP_BOTTOM- A number that sets the amount of visible rows at the bottom.
- To increase the amount of visible rows, use increasing positive values for this argument.
Row and column counting starts at 0 rather than 1, and counting begins at the top left cell of the spreadsheet that has content. Expanding columns to the right or rows to the bottom uses increasing positive values. Increasing columns to the left or rows above uses decreasing negative values.
For example, consider the following spreadsheet:
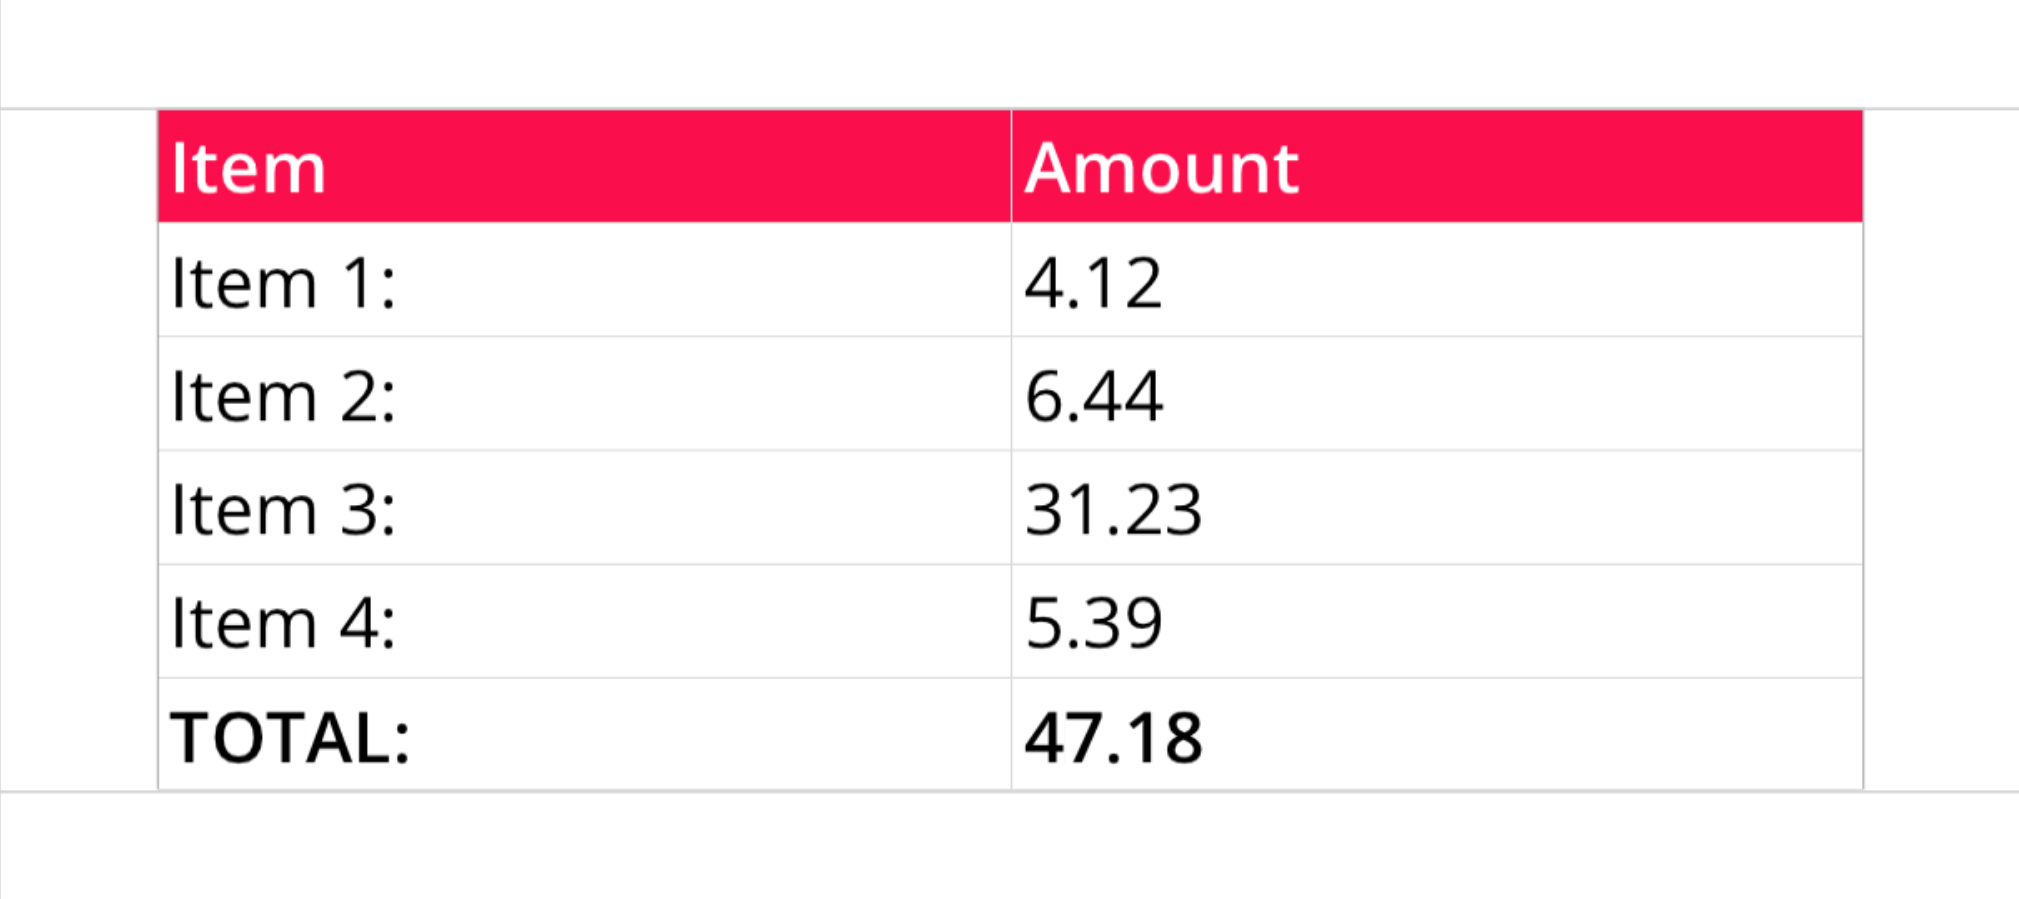
This spreadsheet is cropped perfectly to its content with the following dim:
dim = [0, 0, 1, 5]
To add a column to either side of this spreadsheet, as well as extra rows to the top and bottom, you would need to decrease the CROP_LEFT and CROP_TOP values (since they "move backwards" from the origin cell), and increment the CROP_RIGHT and CROP_BOTTOM values (since they "move forward" from the origin cell).
dim = [-1, -1, 2, 6]
dash.add_spreadsheet()
dash.add_spreadsheet("SHEET_NAME", dim, ssDef, "PANE_NAME")
The dash.add_spreadsheet() function adds the spreadsheet to a designated dashboard pane. This function takes a name, the dim list, the ssDef list, and the target pane's name as arguments.
"SHEET_NAME"- A name for the spreadsheet.
- Example:
"Sheet1"
dim- The
dimlist, which sets the spreadsheet's dimensions.
- The
ssDef- The
ssDeflist, which defines the spreadsheet's contents.
- The
"PANE_NAME"- The name of a pane from the pane list (
pList) that the spreadsheet should be placed on. The name provided for this argument should match a pane name from the pane list.
- The name of a pane from the pane list (
Code Example
# Module import
from row64tools.dash64 import dash64

# Dashboard save path
dash = dash64("/var/www/dashboards/temp/ssheet.dash")

# Establish dashboard panes
pList = [
    ["Main",        "",     "1600",     "900",  "y"],
    ["TopPane", "Main",     "*",        "20%",  ""],
    ["MidPane", "Main",     "*",        "*",    ""],
    ["BottomPane",  "Main",     "*",        "20%",  ""]
]
dash.Layout.set_panes(pList)

# Spreadsheet content list
ssDef = [
    ["A1","Item","BCfa0f4cOFFFFFF"],["B1","Amount","BCfa0f4cOFFFFFF"],
    ["A2","Item 1:"],["B2",    "4.12"],
    ["A3","Item 2:"],["B3",    "6.44"],
    ["A4","Item 3:"],["B4",    "31.23"],
    ["A5","Item 4:"],["B5",    "5.39"],
    ["A6","TOTAL:","B"],["B6", "=SUM(B2:B5)","B","#,###.00"],
]

# Spreadsheet dimensions
dim = [0, 0, 1, 5]

# Add the spreadsheet to a dashboard pane
dash.add_spreadsheet("Sheet1", dim, ssDef, "MidPane")

# Save the dashboard
dash.save()