Diagram with Zoom
Required Components
A diagram with zoom functionality allows users to click and drag on a diagram to move it around in the dashboard pane, and to resize it. These types of diagrams follow the .geo format and require identical components to a geo diagram:
gShapes = []- A list that formats the shape layer. In this list, you can designate the file path for .geo files, establish and name shape layers, and visually format shape layers.
gCoords = []- A list that is normally used to define and format coordinates on a geo diagram. For regular diagrams with zoom, simply leave this list empty.
gDef = []- A list that sets the projection mode. For regular diagrams with zoom, use Projection Mode 0.
dash.add_geo()- A function that places the diagram on a dashboard pane. This function takes the diagram's name, the targeted pane name, and the shapes, coordinate, and definition lists as arguments.
Components Syntax
gShapes
gShapes = [
    [
        ["File",geoFile],
        ["Name","Simple Diagram"],
        ["Color",0x000099],
        ...
    ]
]
The gShapes list defines the shape layer properties of the map, which includes the .geo file locations and shape layer formatting. Each formatting option is encapsulated in brackets [ ], and options are grouped together per .geo within another set of brackets. Individual list items, as well as list groups, are separated by commas.
For a full code example, please refer to the Code Example section below. To see all available shape layer geo options, please refer to the Shape Layer Options section of the DashAPI Geo page.
gDef
gDef = [["ProjectionMode",0]]
For diagrams with zoom, the gDef list is used to specify the projection mode, which should be set to 0 for none.
dash.add_geo()
dash.add_geo("GEO_NAME","PANE_NAME", gDef, gShapes, gCoords)
The dash.add_geo() function adds the map to a designated dashboard pane. This function takes the chart's name, the destination pane's name, and the options lists as arguments.
"GEO_NAME"- A string value that names the chart.
- Example:
"GeoTab"
"PANE_NAME"- The name of a pane from the pane list (
pList) that the chart should be placed on. The name provided for this argument should match a pane name from the pane list. - Example:
"TopPane"
- The name of a pane from the pane list (
gDef- The geo options list.
gShapes- The shapes layer options list.
gCoords- The coordinate layer options list.
Code Example
# Module import
from row64tools.dash64 import dash64
import os
# Dashboard save file
dash = dash64("/var/www/dashboards/temp/diagram.dash")
# Establish dashboard panes
pList = [
["Dashboard", "", "1600", "900", "y"],
["TopPane", "Dashboard", "*", "*", ""],
["BottomPane", "Dashboard", "*", "20%", ""]
]
dash.Layout.set_panes(pList)
# Add a dataframe
dash.add_ramdb("/var/www/ramdb/live/RAMDB.Row64/Examples/HardwareSales.ramdb","DF1")
dash.add_df("DF1", "BottomPane")
# Geo file
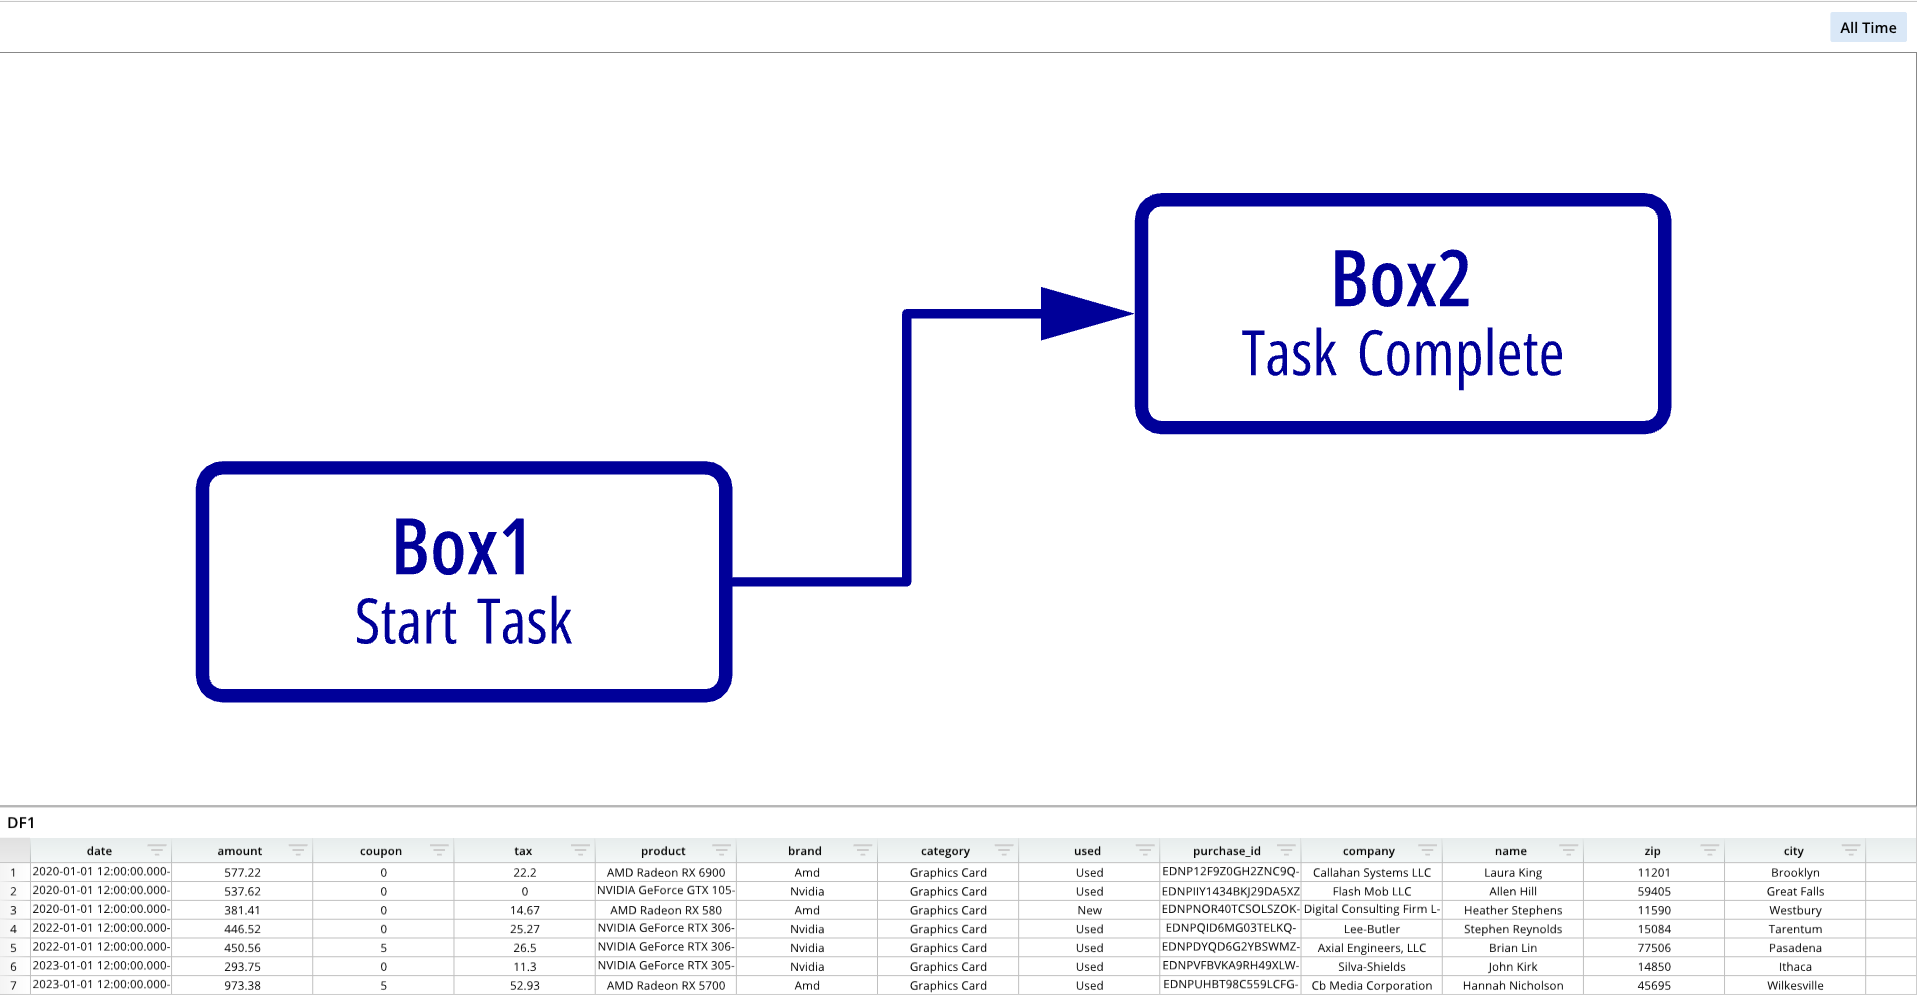
geoFile = os.path.join(dash.get_folder(), "Diagram.geo")
# Geo options list
gDef = [["ProjectionMode",0]]
# Shapes options list
gShapes = [
[
["File",geoFile],
["Name","Simple Diagram"],
["Color",0x000099]
]
]
# Coordinate options list
gCoords = []
# Add the diagram to a dashboard pane
dash.add_geo("GeoTab","TopPane",gDef,gShapes,gCoords)
# Save the dashboard
dash.save()
Format Options
Diagrams with zoom use the same format options as geo diagrams, but do not utilize coordinate point formatting or markers. For a list of format options, please see Geo Format Options.