Dashboard Layout
This article provides a conceptual explanation of how Row64 Dashboard panes are created. For a technical overview on using the pane list (pList) to generate dashboard panes, please see the Pane List page.
Overview of Dashboard Panes
Row64 dashboards are designed with a powerful, simple, and flexible pane layout system. When dividing dashboards into multiple panes, you are establishing a visual hierarchy where the dashboard is divided into sections, and the sub-sections are divided into smaller parts.
Each time you divide space, you create new panes.
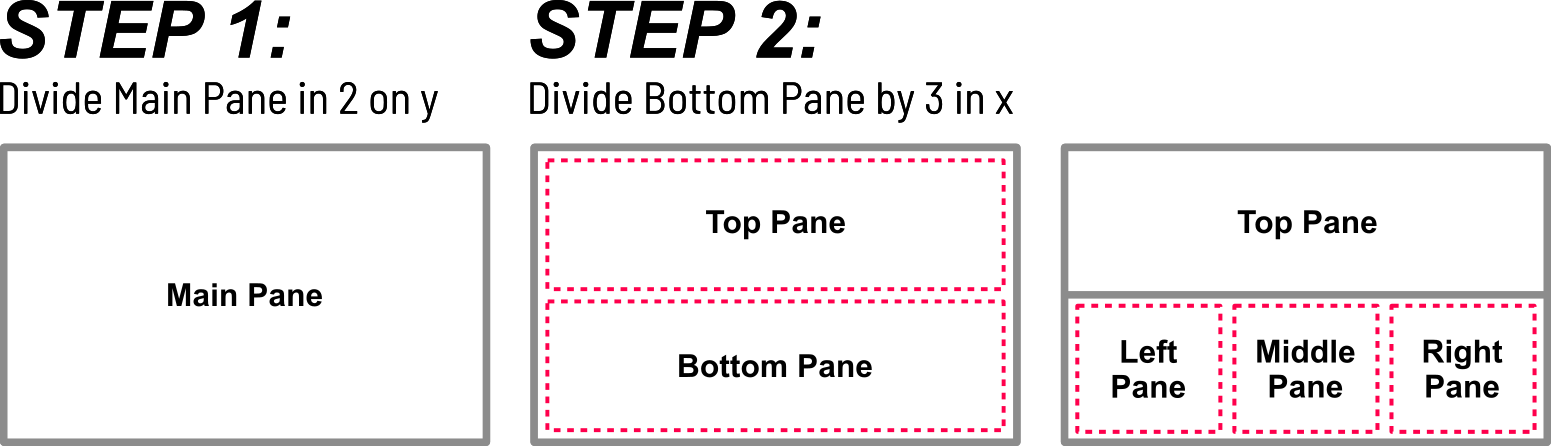
The division of parent panes into children panes establishes a visual hierarchy.
As an example, if a user designs a dashboard with three panes, there will be three visible panes that are available for use.
Although there are three visible panes, five panes are created in total. The additional two panes are construction panes that were used as parent panes.
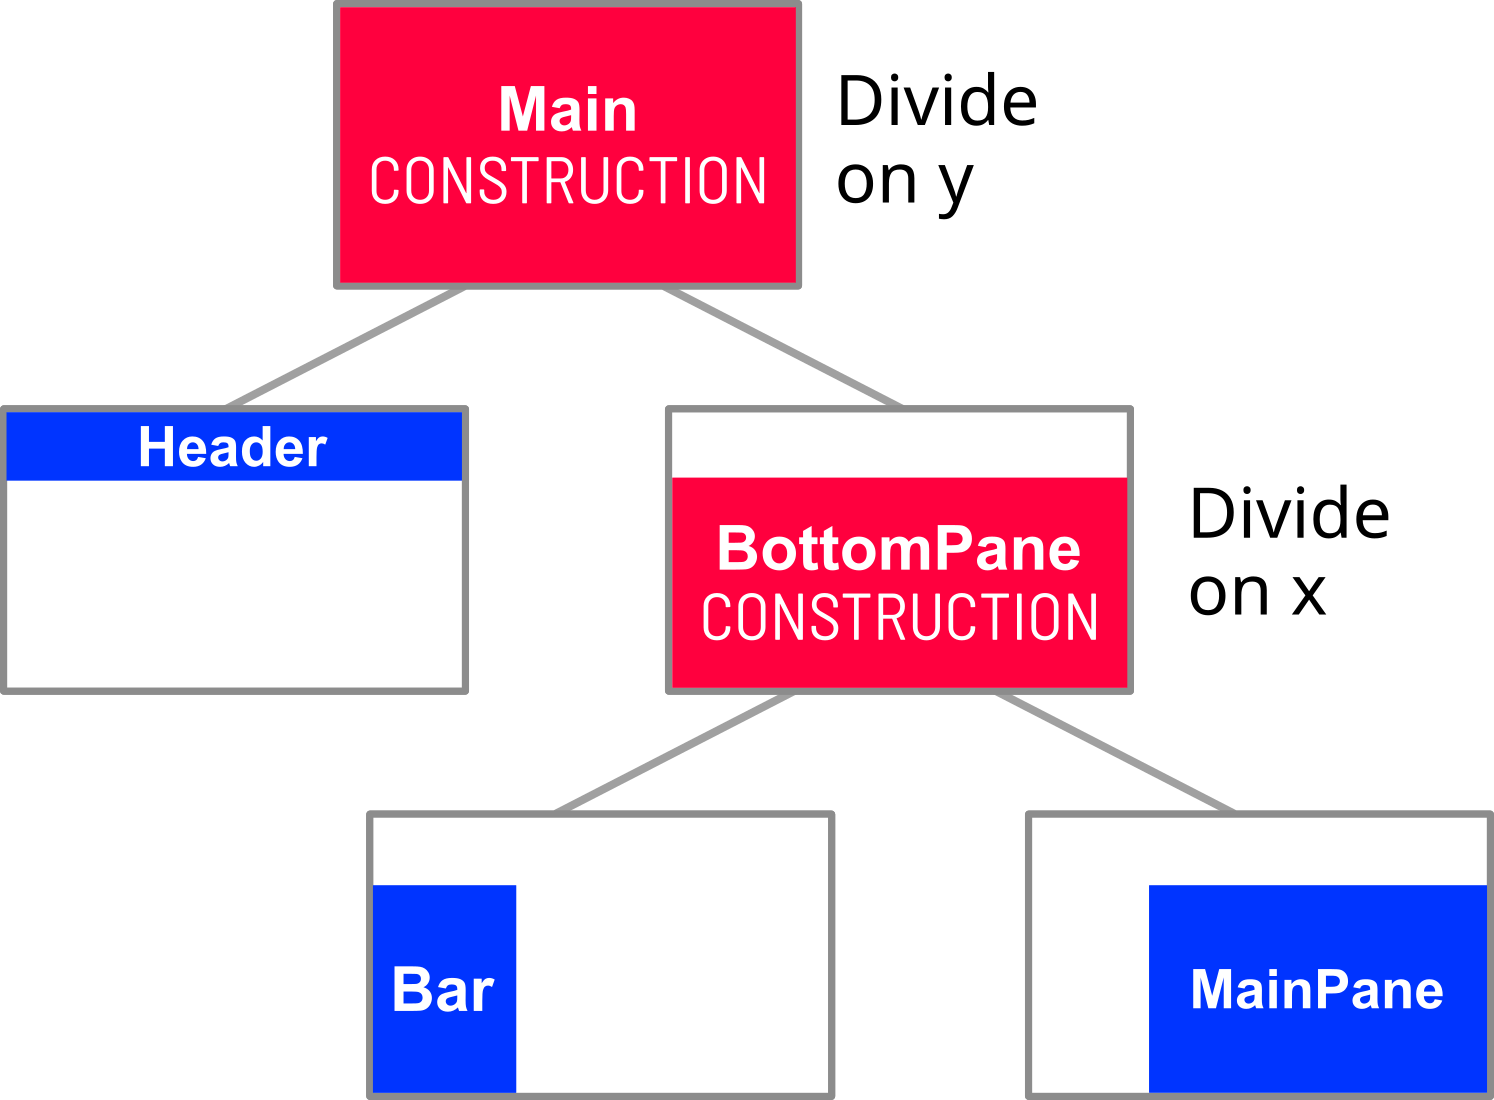
Construction panes are used to establish the major areas of the dashboard, and these construction panes are divided into usable panes that are populated with dashboard elements.
Defining Pane Resizing Behavior
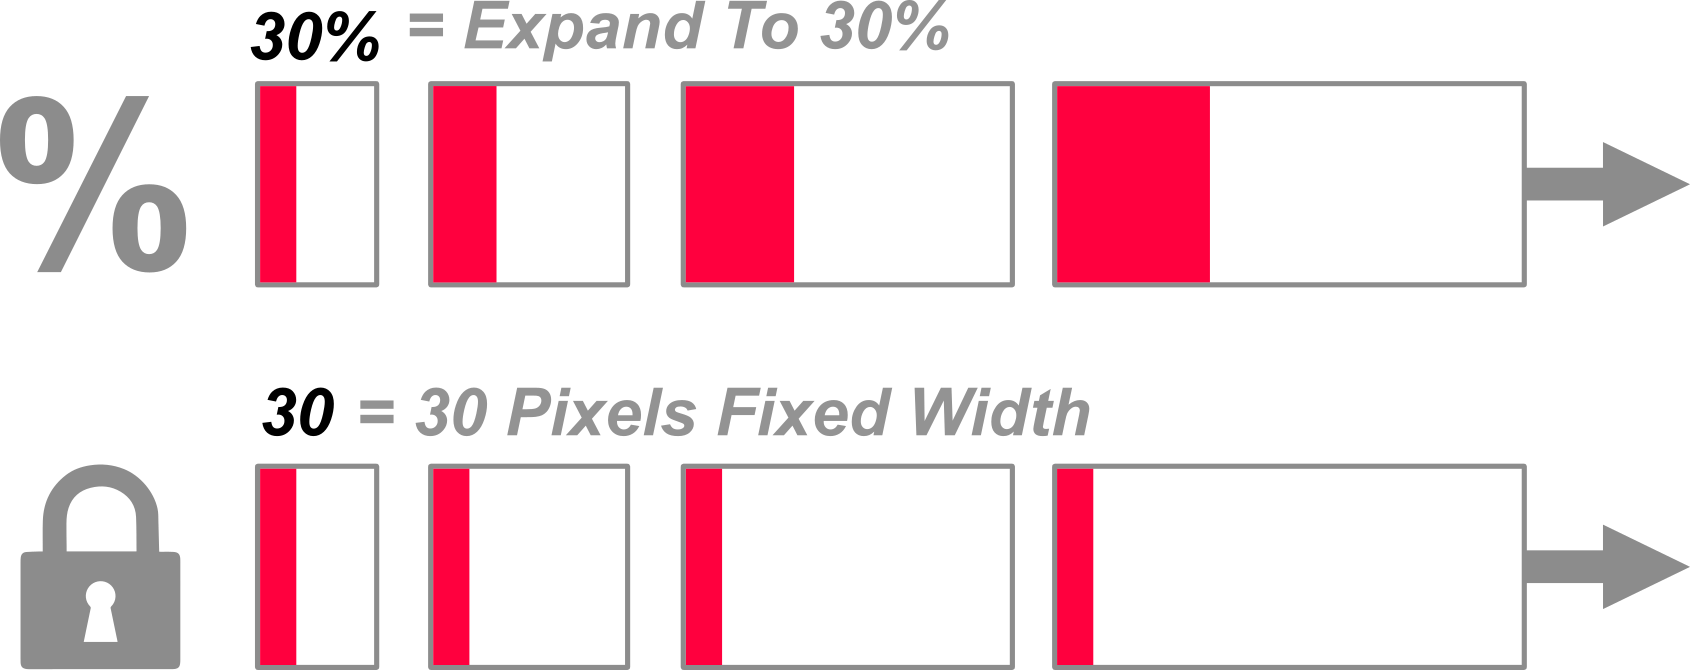
Dashboard pane resizing behavior can be defined by the user. When a dashboard is resized and expanded, the user can determine how the dashboard's panes react, such as if they expand with the dashboard, remain fixed at static values, or expand at a percentage rate.
- To allow a dashboard pane to expand freely with the overall dashboard, no value is given to the configuration.
- To set a pane at a fixed value, whether for height or width, you simply input a number that represents the desired size in pixels (i.e.
30). - To allow a pane to expand or contract at a percentage rate, provide a number with a percent sign (i.e.
30%).
Minimal Example
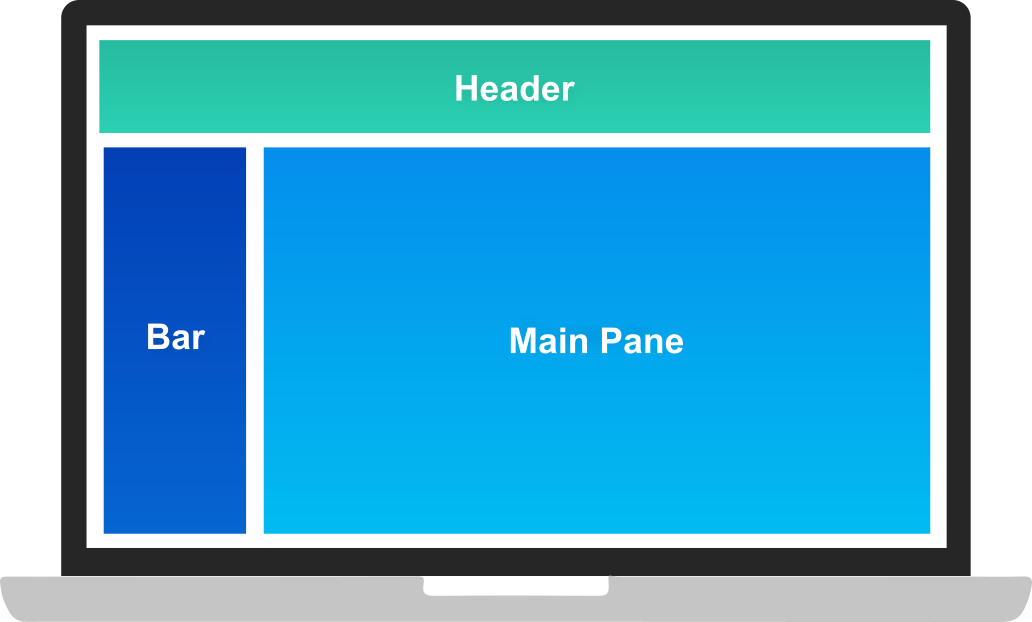
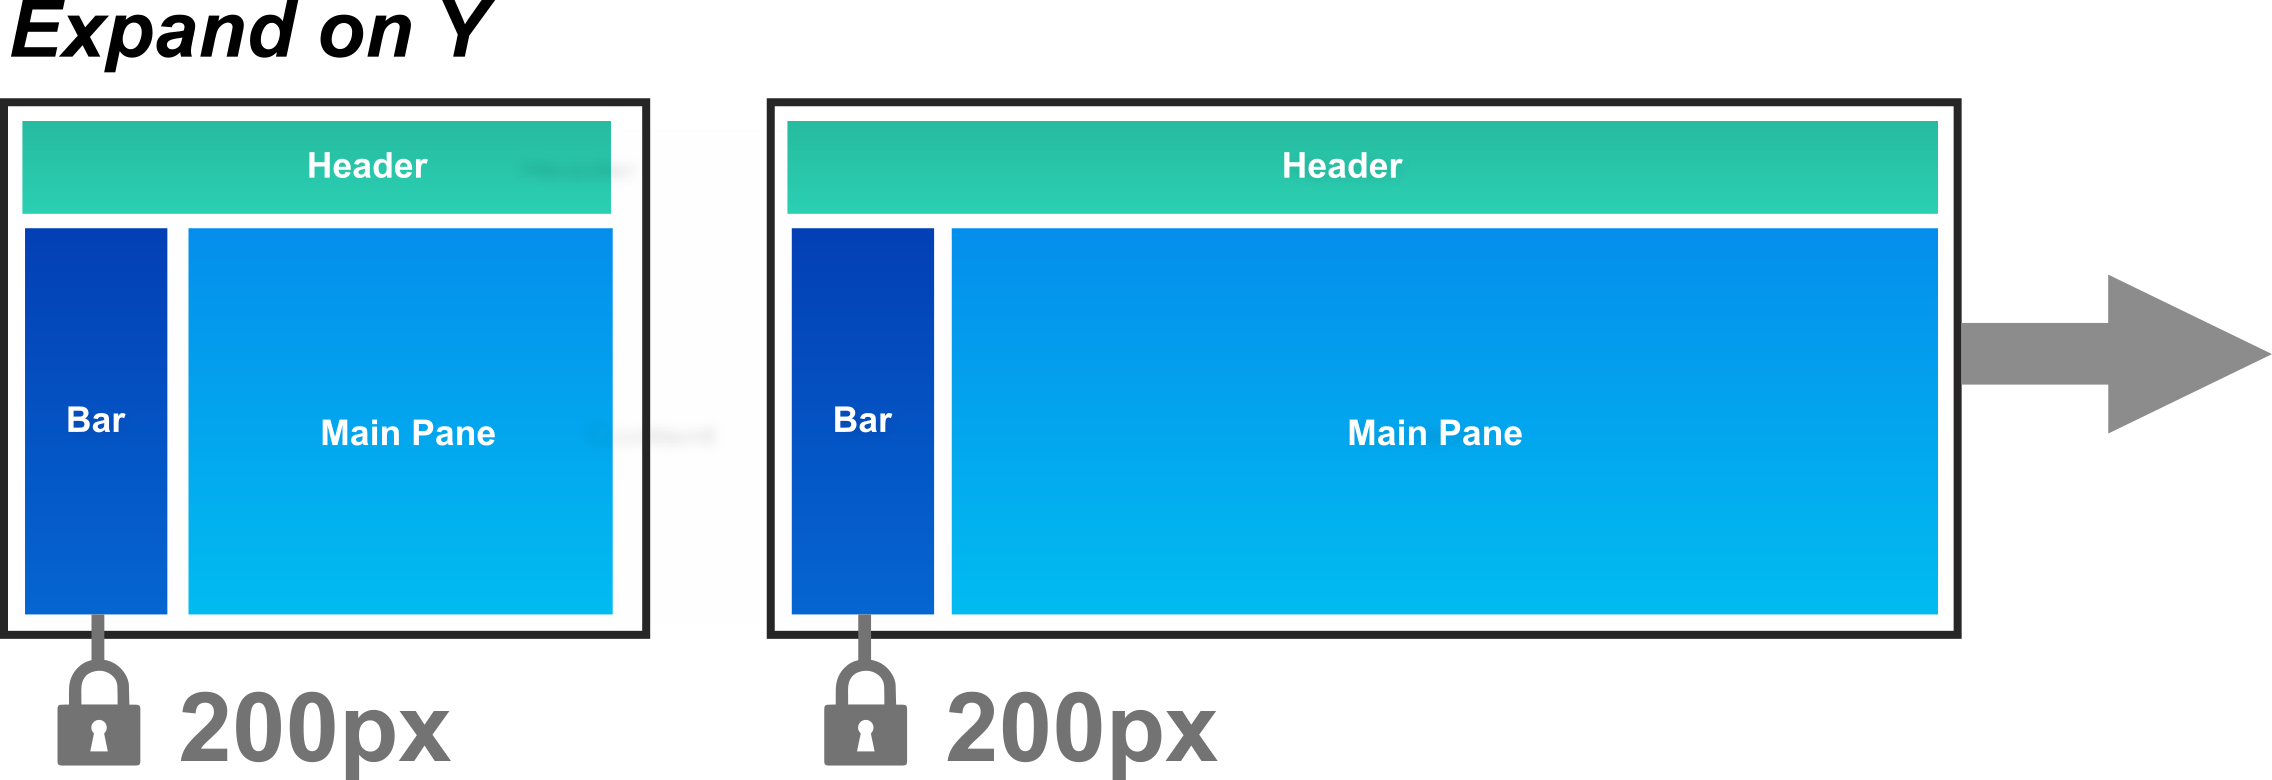
The following image shows a simple three-pane dashboard layout. This three-pane example dashboard consists of a Header, a Bar, and a Main Page:
In this example, we want to configure this layout so that the Bar remains the same size when expanding horizontally, and for the Header to remain the same size when expanding vertically. For instance, the Bar should have a width of 200 pixels that remains fixed when the dashboard expands or contracts horizontally.
In this example, assume that the y-axis is horizontal, and the x-axis is vertical.
To meet the goals of this example, the Header and Bar panes need to be given fixed value sizes for their sides that should not expand. The Bar needs to be given a fixed value for its width, and the Header for its height. The following code is the Python configuration that sets the needed properties:
pList = [
    ["Main",        "",             "1000", "800",  "y"],
    ["Header",      "Dashboard",    "*",    "120",  "" ],
    ["BottomPane",  "Dashboard",    "*",    "*",    "x"],
    ["Bar",         "BottomPane",   "200",  "*",    "" ],
    ["MainPane",    "BottomPane",   "*",    "*",    "" ]
]
pList
The pList block in the Python configurations establishes the pane layout. "pList" stands for "pane list." To understand the structure of the pList block, please refer to the Pane List page.
In the Python block above, notice that the Header has a fixed value of 120 (pixels) for its height, whereas the Bar has a set value of 200 (pixels) for its width. So, if the dashboard expands horizontally, the width of the Bar does not change, but the Header's and Main Pane's does.
Similarly, if the dashboard expands vertically, the Header's height does not change, but the Bar's and the Main Pane's does.
The Main Pane is not given any fixed values and is allowed to expand horizontally and vertically.
Adding More Panes
More complex dashboards may involve more panes. Additional panes can be added with Python configurations.
For example, a user might want to add a Right Bar and a Footer to the three-pane dashboard from earlier to resemble the following layout:
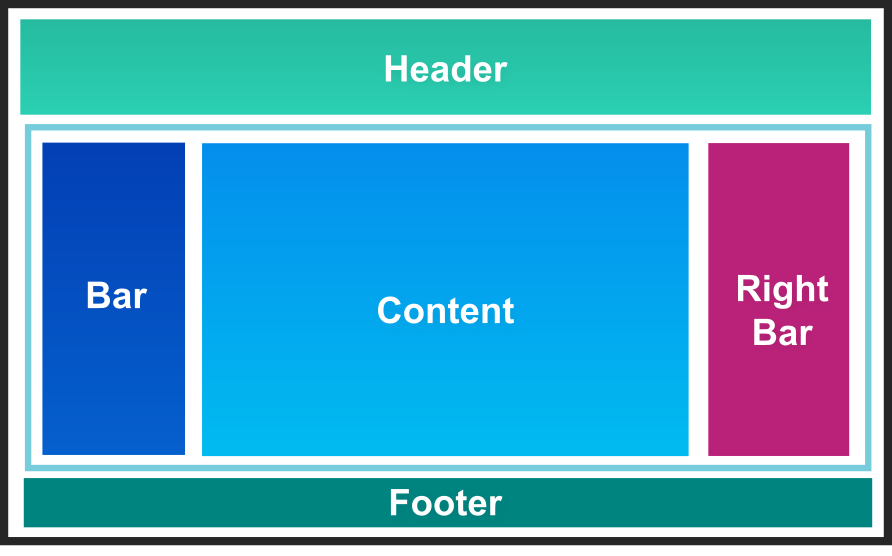
The following Python configuration adds the needed panes, but also applies a background color, text, and text formatting to each pane:
from row64tools.dash64 import dash64
dash = dash64("/var/www/dashboards/temp/layout_demo.dash")
pList = [
    ["Main",                "",                 "1000",         "800",      "y"],
    ["Header",              "Main",             "*",            "15%",      "" ],
    ["BottomPane",          "Main",             "*",            "*",        "x"],
    ["Footer",              "Main",             "*",            "10%",      "" ],
    ["Bar",                 "BottomPane",       "20%",          "*",        "" ],
    ["MainPane",            "BottomPane",       "*",            "*",        "" ],
    ["RightBar",            "BottomPane",       "20%",          "*",        "" ]
]
dash.Layout.set_panes(pList)
dash.set_pane_def("Header", [["Color",0xa2e9dc],["Text","Header","BH2V2S35"]])
dash.set_pane_def("Bar", [["Color",0x0344b9],["Text","Bar","BH2V2S35OFFFFFF"]])
dash.set_pane_def("MainPane", [["Color",0x02a8ee],["Text","MainPane","BH2V2S35OFFFFFF"]])
dash.set_pane_def("Footer", [["Color",0x008480],["Text","Footer","BH2V2S35OFFFFFF"]])
dash.set_pane_def("RightBar", [["Color",0xba2279],["Text","RightBar","BH2V2S35OFFFFFF"]])
dash.save()
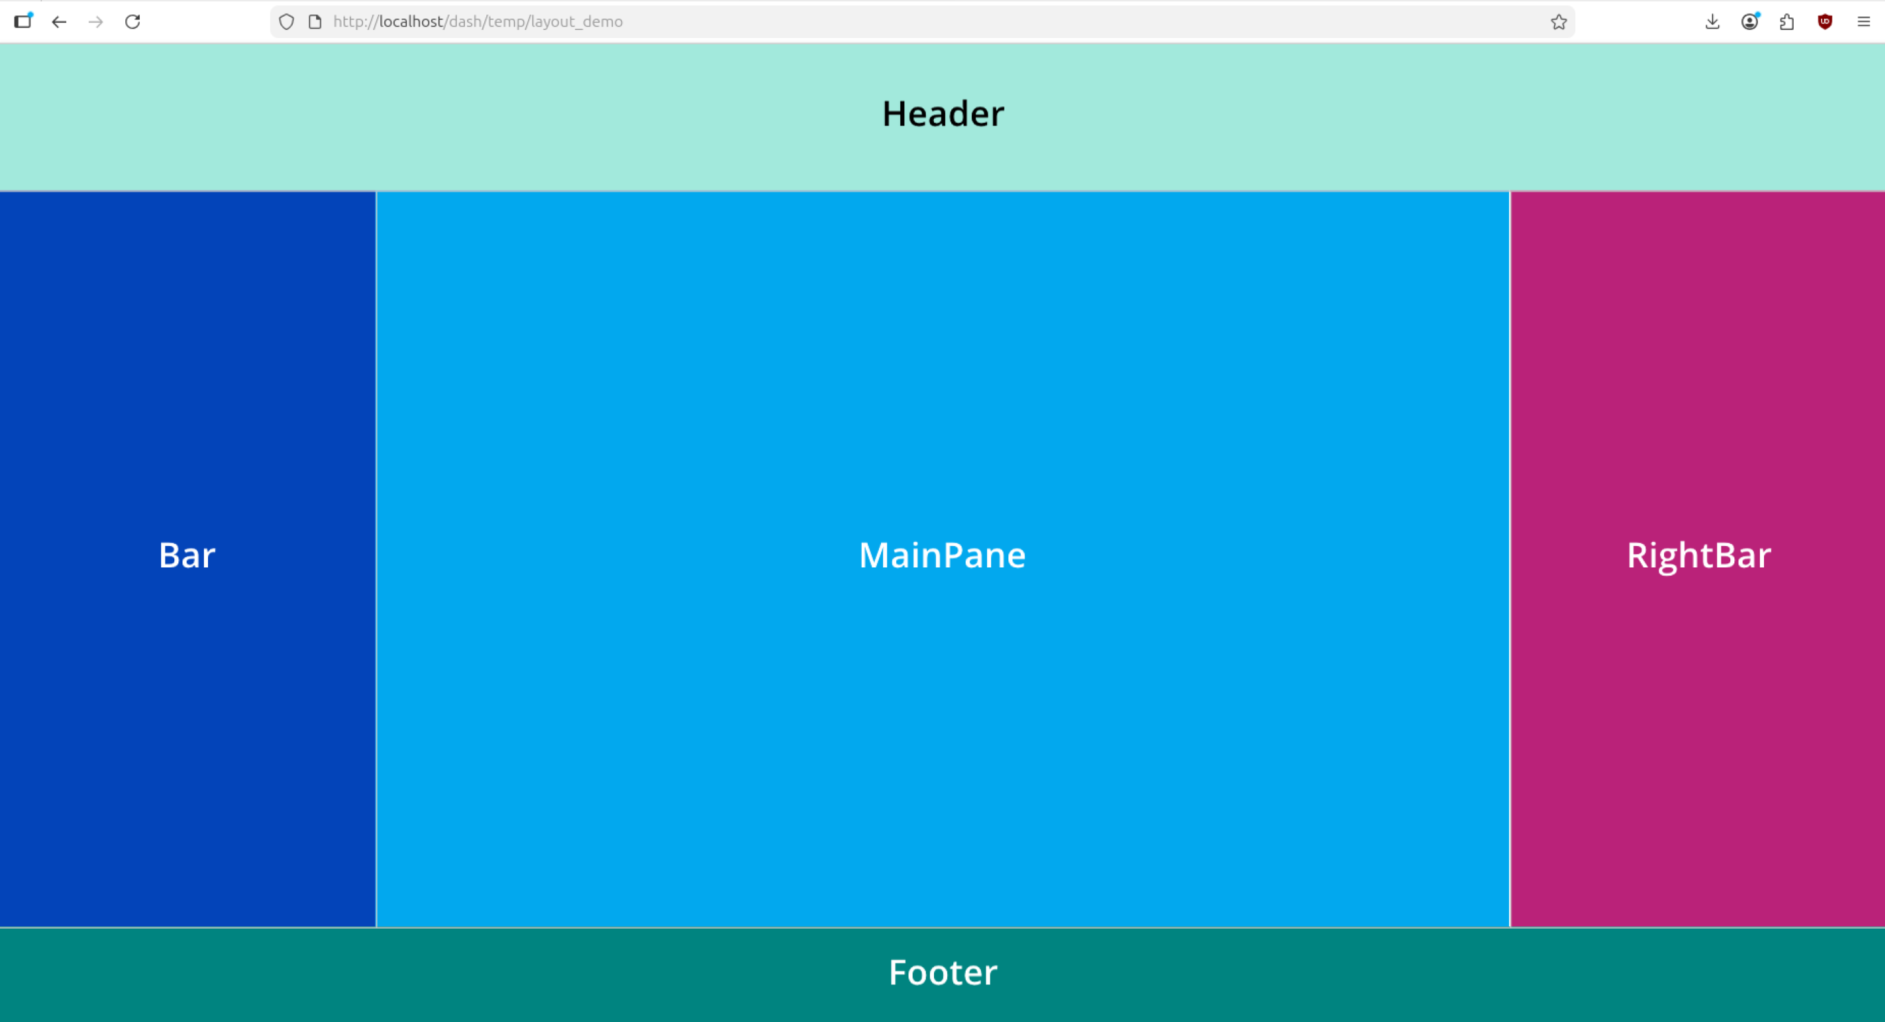
In the code above, the pList block defines the panes and their expansion behaviors. Below, the dash.set_pane_def(...) lines define the colors, text, and text formatting of those panes.
When you view the dashboard in a browser, it will resemble the targeted design:
Pane Formatting and Content
To learn more about dashboard pane formatting, please see the Pane Formatting page. For information on adding various types of content to dashboard panes, please see the Dashboard Content section of the DashAPI documentation.