Venn Diagram
Required Components
Adding a Venn diagram requires the following components:
vDef = []- A list that establishes the chart's name, labels, and values, based on the underlying dataframe or data node.
vOptions = []- A list of format options that changes the visual appearance of the chart.
dash.add_wordcloud()- The function that places the chart on a designated pane. The structure and formatting lists are passed into this function.
Note that the definition and options lists are simply Python lists and that their variable names can change.
Components Syntax
vDef
vDef = [
    [ "Values", "RANGE_1", "RANGE_2", "RANGE_3" ],
    [ "Labels","LABEL_1","LABEL_2","LABEL_3"]
]
The vDef ("Venn definition") list establishes the chart's overall structure by defining the chart's values and labels.
"RANGE"- A cell range to use for a data set.
- Example:
"=DF1!E:E"
"LABEL"- A string-based label for a data set.
- Example:
"Chocolate"
vOptions
vOptions = [
    ["Format", "FlipVenn3", True],
    ["Format", "LabelShift", .17],
    ...
]
The vOptions list is a list of formatting options that changes the appearance of the chart. Each formatting item is enclosed in brackets [ ... ] and separated by commas. A full list of formatting options is available in the Venn Diagram Format Options section.
dash.add_venn()
dash.add_venn("CHART_NAME", "PANE_NAME", vDef, vOptions)
The dash.add_pie() function adds the chart to a designated dashboard pane. This function takes the chart's name, the destination pane's name, and the definition and formatting lists as arguments.
"CHART_NAME"- The name you want to give the chart.
"PANE_NAME"- The name of a pane from the pane list (
pList) that the chart should be placed on. The name provided for this argument should match a pane name from the pane list.
- The name of a pane from the pane list (
vDef- The definition list, which defines the chart's values and labels.
vOptions- The options list, which defines the chart's visual appearance and formatting.
Code Example
# Module import
from row64tools.dash64 import dash64
# Dashboard save location
dash = dash64("/var/www/dashboards/temp/venn.dash")
# Establish dashboard panes
pList = [
["Dashboard", "", "1600", "900", "y"],
["TopPane", "Dashboard", "*", "*", ""],
["BottomPane", "Dashboard", "*", "20%", ""]
]
dash.Layout.set_panes(pList)
# Add and format a dataframe
dash.add_ramdb("/var/www/ramdb/live/RAMDB.Row64/Examples/FoodGPA.ramdb","DF1")
dash.add_df("DF1", "BottomPane")
dInd = dash.Sheets.get_sheet_ind("DF1")
cWidths = dash.Sheets.Items[dInd].ColumnWidths
cWidths[2] = 500 # set the paragraph text columns to be wider
cWidths[3] = 500
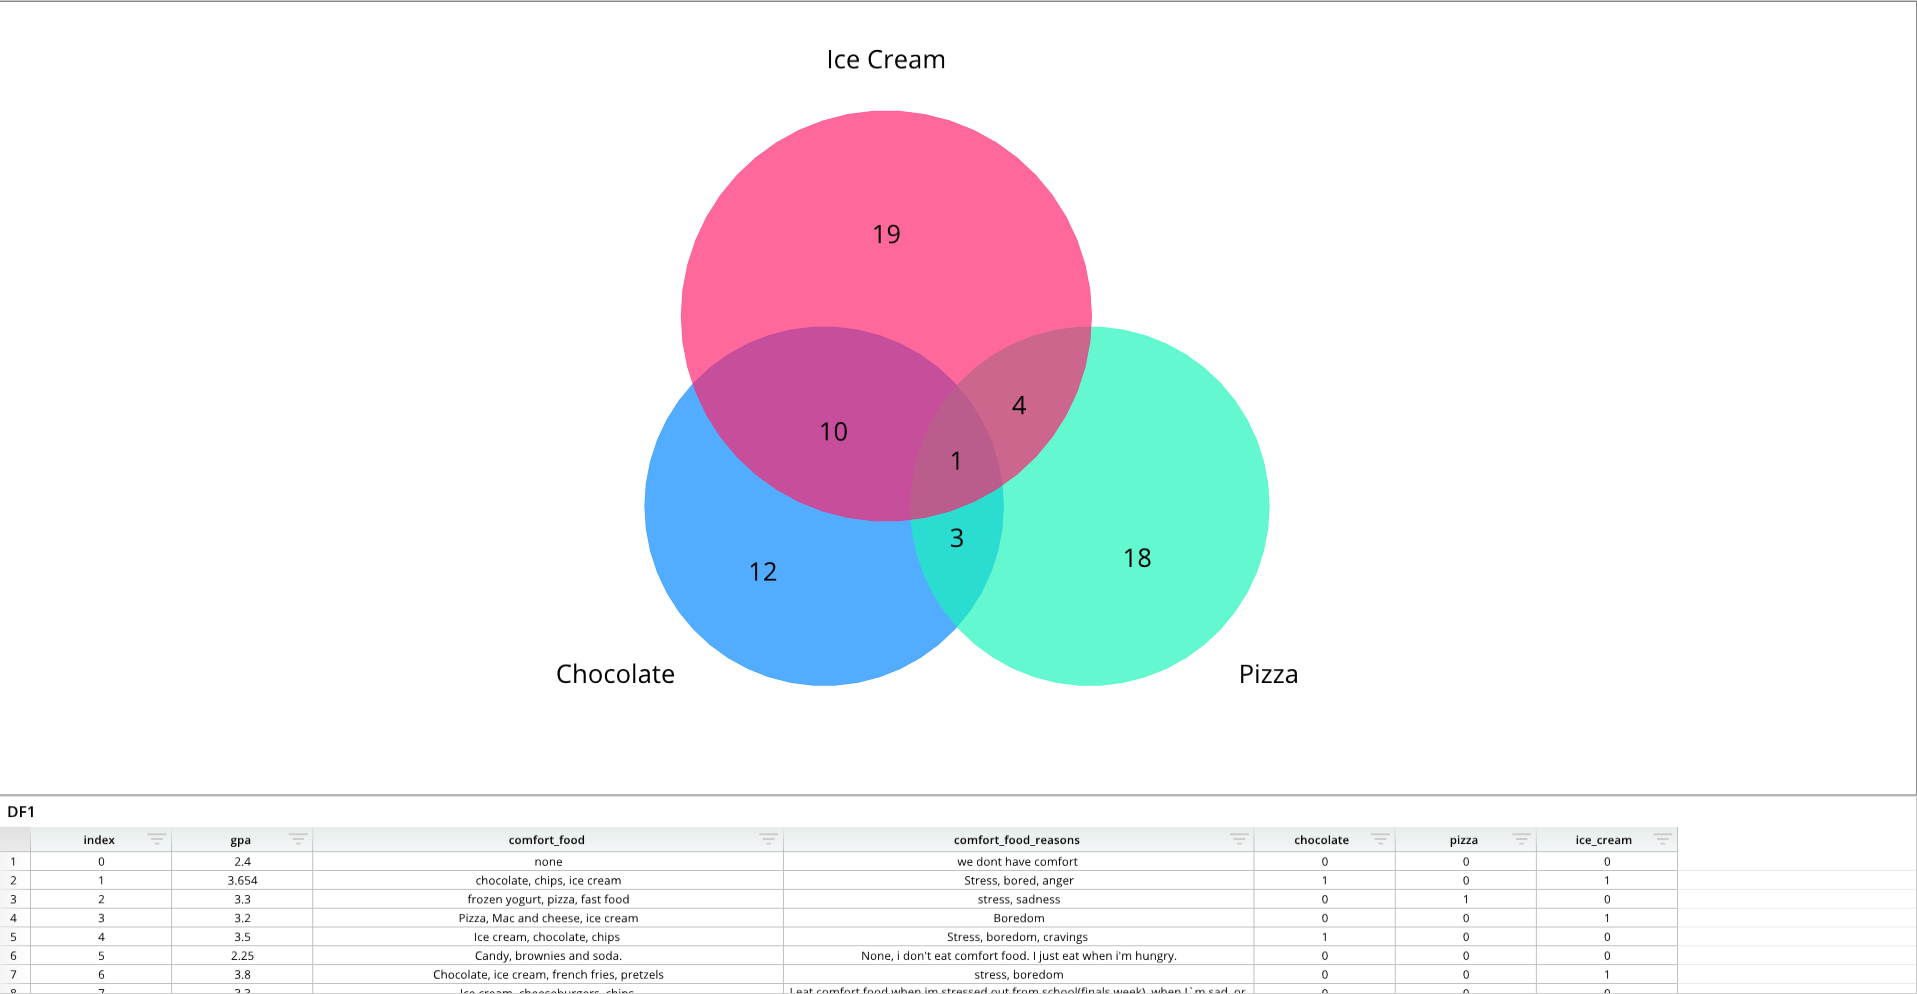
# Venn diagram definition list
vDef = [
[ "Values", "=DF1!E:E", "=DF1!F:F", "=DF1!G:G" ],
[ "Labels","Chocolate","Pizza","Ice Cream"]
]
# Venn diagram formatting options list
vOptions = [
["Format", "FlipVenn3", True],
["Format", "LabelShift", .17],
["Format", "PrimaryFont","Size", 35],
["Format", "SecondaryFont","Size", 35],
["Details", "ColorTheme",[0x0086ff,0x1ef4ba,0x00ffb9,0xff216c]],
]
# Add the chart to a dashboard pane
dash.add_venn("Venn1", "TopPane", vDef, vOptions)
# Save the dashboard
dash.save()
Venn Diagram Format Options
The following tables list the available formatting options for Venn diagrams. To format Venn diagrams, include formatting items in the vOptions list. Each formatting item should be encapsulated in brackets [ ], and formatting items should be separated by commas. For an example of a vOptions list with multiple formatting items, please see the Code Example above.
General Formatting
| Parameter Keys | Value Type | Example | Description |
|---|---|---|---|
| "Format","Color" | int - hex color | ["Format","Color",0x000000] | Background Color of the Pane |
| "Format","CrossLinking" | bool | ["Format","CrossLinking",False] | False = Disable Cross filtering for this Pane |
| "Format","Pad" | float | ["Format","Pad",.15] | Percentage of Total Height/Width Padding on Pane |
| "Format","LabelShift" | float | ["Format","LabelShift",.3] | Position of Value Labels as a percentage relative to top of bar |
| "Format","PrimarySep" | int | ["Format","PrimarySep",3] | Primary Seperator Between Label Parts: 0 = none, 1 = comma, 2 = semicolon, 3 = period, 4 = newline, 5 = space |
| "Format","SecondarySep" | int | ["Format","SecondarySep",3] | Secondary Seperator Between Label Parts: 0 = none, 1 = comma, 2 = semicolon, 3 = period, 4 = newline, 5 = space |
| "Format","LabelTypes" | [int,int,int] | ["Format","LabelTypes",[2,0,0]] | Content of Point Label [primary, secondary1, secondary2] where 0 = none, 1 = label, 2 = value |
| "Format","Reverse" | bool | ["Format","Reverse",True] | Reverses primary & secondary order of Labels |
| "Format","RadiusScale" | float | ["Format","RadiusScale",.7] | Venn Circle Scale to fit within the pane. Between 0 - 1 |
| "Format","FillAlpha" | float | ["Format","FillAlpha",.68] | Transparency of Venn Circles, Between 0 - 1 |
| "Format","FlipVenn3" | bool | ["Format","FlipVenn3",True] | True = Venn3 Single Circle On Top, False = Single Circle On Bottom |
| "Format","RotateIndex" | int | ["Format","RotateIndex",3] | Rotation of Venn Diagram by Index, 0 or 1 for Venn2. 0,1,2 for Venn3 |
| "Format","FontAlignment" | [float,float] | ["Format","FontAlignment",[0.5,0.6]] | Alignment of Label Text [x alignment, y alignment] between 0 - 1 |
| "Format","PrimaryFont","Size" | float | ["Format","PrimaryFont","Size",25] | Font size of Primary Label |
| "Format","PrimaryFont","Color" | int - hex color | ["Format","PrimaryFont","Color",0xFF000] | Font Color of Primary Label |
| "Format","PrimaryFont","Bold" | bool | ["Format","PrimaryFont","Bold",True] | Font Bold of Primary Label |
| "Format","PrimaryFont","Italic" | bool | ["Format","PrimaryFont","Italic",True] | Font Italic of Primary Label |
| "Format","PrimaryFont","Underline" | bool | ["Format","PrimaryFont","Underline",True] | Font Underline of Primary Label |
| "Format","PrimaryFont","Alpha" | float | ["Format","PrimaryFont","Alpha",.5] | Font Transparency of Primary Label |
| "Format","SecondaryFont","Size" | float | ["Format","SecondaryFont","Size",25] | Font size of Secondary Label |
| "Format","SecondaryFont","Color" | int - hex color | ["Format","SecondaryFont","Color",0xFF000] | Font Color of Secondary Label |
| "Format","SecondaryFont","Bold" | bool | ["Format","SecondaryFont","Bold",True] | Font Bold of Secondary Label |
| "Format","SecondaryFont","Italic" | bool | ["Format","SecondaryFont","Italic",True] | Font Italic of Secondary Label |
| "Format","SecondaryFont","Underline" | bool | ["Format","SecondaryFont","Underline",True] | Font Underline of Secondary Label |
| "Format","SecondaryFont","Alpha" | float | ["Format","SecondaryFont","Alpha",.5] | Font Transparency of Secondary Label |
Series Data
(Index must be zero; Venn diagrams only contain a single series).
| Parameter Keys | Value Type | Example | Description |
|---|---|---|---|
| "Series",0,"Name" | string | ["Series",0,"Name","Enter Series Name"] | Name of the series |
| "Series",0,"Labels" | string | ["Series",0,"Labels","=DF1!B:B"] | Lables on the series (list or cell reference like Excel) |
| "Series",0,"Values" | string | ["Series",0,"Values","=DF1!A:A"] | Lables on the series (list or cell reference like Excel) |
Details
| Parameter Keys | Value Type | Example | Description |
|---|---|---|---|
| "Details","ColorTheme" | [float,float,float,float] | ["Details", "ColorTheme",[0xaf4425,0x662e1c,0xc9a66b,0xebdcb2]] | Color Theme For WordCloud |
| "Details","ShowTitle" | bool | ["Details","ShowTitle",True] | Show Chart Title |
| "Details","Title" | string | ["Details","Title","Enter Chart Title"] | String of Chart Title |
| "Details","TitleFont","Size" | float | ["Details","TitleFont","Size",25] | Font size of Title (if ShowTitle is True) |
| "Details","TitleFont","Color" | int - hex color | ["Details","TitleFont","Color",0xFF000] | Font Color of Title (if ShowTitle is True) |
| "Details","TitleFont","Bold" | bool | ["Details","TitleFont","Bold",True] | Font Bold of Title (if ShowTitle is True) |
| "Details","TitleFont","Italic" | bool | ["Details","TitleFont","Italic",True] | Font Italic of Title (if ShowTitle is True) |
| "Details","TitleFont","Underline" | bool | ["Details","TitleFont","Underline",True] | Font Underline of Title (if ShowTitle is True) |
| "Details","TitleFont","Alpha" | float | ["Details","TitleFont","Alpha",.5] | Font Transparency of Title (if ShowTitle is True) |
| "Details","TitlePos" | [float,float] | ["Details","TitlePos",[.5,.05]] | Chart Title x,y as a percentage of Pane Height/Width |
| "Details","Layout","RPadding" | float | ["Details","Layout","RPadding",10.0] | Chart Right Padding Inset In Addition To Pane Padding |
| "Details","Layout","LPadding" | float | ["Details","Layout","LPadding",10.0] | Chart Left Padding Inset In Addition To Pane Padding |
| "Details","Layout","TPadding" | float | ["Details","Layout","TPadding",10.0] | Chart Top Padding Inset In Addition To Pane Padding |
| "Details","Layout","BPadding" | float | ["Details","Layout","BPadding",10.0] | Chart Bottom Padding Inset In Addition To Pane Padding |
| "Details","Layout","HasChartBorder" | bool | ["Details","Layout","HasChartBorder",True] | Chart Border Around Chart Area (Does Not Include Label Area) |
| "Details","Layout","ChartBorder","Color" | int - hex color | ["Details","Layout","ChartBorder","Color",0xFF000] | Line color of Chart Border |
| "Details","Layout","ChartBorder","Size" | float | ["Details","Layout","ChartBorder","Size",2.1] | Line size / thickness of Chart Border |
| "Details","Layout","ChartBorder","Alpha" | float | ["Details","Layout","ChartBorder","Alpha",.5] | Line transparency of Chart Border |
| "Details","Layout","HasChartFill" | bool | ["Details","Layout","HasChartFill",True] | Fill Inner Chart Area (Does Not Include Label Area) |
| "Details","Layout","ChartFill","Color" | int - hex color | ["Details","Layout","ChartFill","Color",0xFF000] | Fill Color Of Inner Chart Area |
| "Details","Layout","ChartFill","Alpha" | float | ["Details","Layout","ChartFill","Alpha",.5] | Transparency Of Inner Chart Area Fill |
| "Details","Layout","HasBkgdFill" | bool | ["Details","Layout","HasBkgdFill",True] | Fill Chart Area (Drawn Overtop Of Any Pane Color) |
| "Details","Layout","BkgdFill","Color" | int - hex color | ["Details","Layout","BkgdFill","Color",0xFF000] | Fill Color Of Chart Area (Drawn Overtop Of Any Pane Color) |
| "Details","Layout","BkgdFill","Alpha" | float | ["Details","Layout","BkgdFill","Alpha",.5] | Transparency Of Chart Area Fill (Drawn Overtop Of Any Pane Color) |